
Includes historical data for Bangladesh’s Gross Domestic Product growth, debt-to-GDP ratio and more, as well as information on trade, banking and financial sector leadership.
Rising Prosperity But Challenges Remain
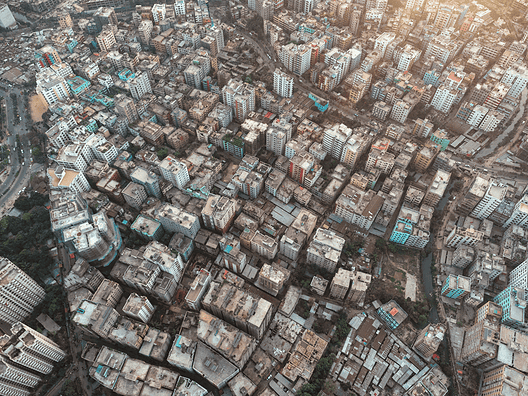
Bangladesh’s economic landscape showcases a mix of strengths and challenges. This nation of about 170 million has achieved remarkable progress, transitioning from one of the world’s poorest countries at its inception in 1971 to lower-middle-income status in 2015. Key advantages include favorable demographics, robust garment exports, significant remittance inflows, and progress in financial inclusion facilitated by microfinance and mobile services.
However, challenges ranging from bureaucratic hurdles and corruption to poor infrastructure and climate vulnerabilities continue to hinder foreign investment and undermine the government’s efforts to achieve upper middle-income status by 2031.
Macroeconomy & Sovereign Data
| Type of Government | Parliamentary republic |
|---|---|
| Capital | Dhaku |
| Sovereign Ratings |
S&P: B+ Moody’s: B2 Fitch: B+ |
| Total Population | 173.7 million |
| Median Age | 25.98 |
| Adult Per Capita Income (PPP) | USD 14,621.11 |
| Total GDP (2025) | USD 475 billion |
Bangladesh GDP & Economic Overview
Most Recent Content
Bangladesh
Emerging & Frontier Markets
Bangladesh: Diversification Is A Priority
Economics, Policy & Regulation
Central Banker Report Cards 2024: Asia-Pacific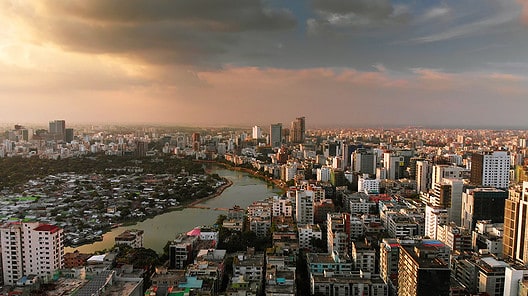
Emerging & Frontier Markets
Bangladesh: Riding The Growth WaveBanking & Finance
Trade & Investment
| Total Exports | USD 41.4 billion (2024) |
|---|---|
| Leading Exports |
Garments Footwear Fabric Textiles Trunks and Cases |
| Total Imports | USD 63 billion (2024) |
| Leading Imports |
Refined Petroleum Cotton Fabric Natural Gas Cotton Fabric |
| Source: | IMF, CIA The World Factbook |
Bangladesh Leading Companies
| Sonali Bank | Financials |
|---|---|
| Janata Bank Limited | Financials |
| Square Pharmaceuticals | Healthcare |
| Petrobangla | Energy, Exploration & Production |
| Bangladesh Steel Corporation | Materials |
| Walton Hi-Tech Industries | Consumer Electronics & Appliances |
| Grameenphone Bangladesh | Telecommunication Services |
Major Trade Partners — Import
| China | 21.5% |
|---|---|
| India | 12.2% |
| Singapore | 9.19% |
| Hong Kong SAR | 5.5% |
| Indonesia | 4.6% |
Major Trade Partners — Export
| United States | 19.3% |
|---|---|
| Germany | 14.7% |
| United Kingdom | 11% |
| Spain | 5.8% |
| France | 5.5% |
Global Finance Rankings & Awards
Data Sources:
UN World Population Prospects
World Inequality Report
S&P Global Ratings
Moody’s
Fitch Ratings
IMF Direction of Trade Statistics (DOTS)
UN Conference on Trade and Development (UNCTAD)
CIA The World Factbook
World Bank’s World Integrated Trade Solution
Forbes Global 2000