Includes historical data for Botswana’s Gross Domestic Product growth, debt-to-GDP ratio and more, as well as information on trade, banking and financial sector leadership.
Economy Driven By Tourism And Trade
Nestled among South Africa, Namibia, Zimbabwe and Zambia, Botswana’s strategic location in southern Africa positions it as an essential transit and trade conduit for the region. Botswana’s political stability and governance standards, along with it fiscal discipline, a well-capitalized banking system and an independent judiciary, place it among the top countries in sub-Saharan Africa for the quality of its business environment. With a sparse population of less than 3 million people inhabiting a vast landmass, Botswana also boasts some of Africa’s largest wilderness areas, making safari-based tourism another significant source of income.
Despite these strengths, Botswana’s economy remains heavily reliant on diamond sales, which contribute nearly 90% of its foreign exchange earnings, leaving the country vulnerable to shifts in global consumer spending. The government’s efforts to diversify the economy and enhance private-sector opportunities have yielded uneven results. Additional challenges include a small domestic market, inadequate infrastructure, significant inequality, and high unemployment rates.
Macroeconomy & Sovereign Data
| Type of Government | Parliamentary republic |
|---|---|
| Capital | Gabarone |
| Sovereign Ratings |
S&P: BBB+ Moody’s: A3 Fitch: Not rated |
| Total Population | 2.7 million |
| Median Age | 24.0 |
| Adult Per Capita Income (PPP) | 26,075.44 |
| Total GDP (2023) | 21.4 billion |
Botswana GDP & Economic Overview
Most Recent Content
Botswana

Economics, Policy & Regulation
Botswana Turns A Political Page
Economics, Policy & Regulation
Central Banker Report Cards 2024: Africa And The Middle East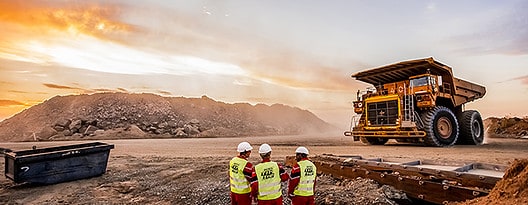

Features
Mobile’s Last BarriersBanking & Finance
Trade & Investment
| Total Exports | USD 6.5 billion (2023) |
|---|---|
| Leading Exports |
Diamonds Insulated Wiring Copper Beef Gold |
| Total Imports | USD 7.3 billion (2022) |
| Leading Imports |
Diamonds Refined Petroleum Cars Delivery Trucks Electricity |
| Source: | World Integrated Trade Solution |
Botswana Leading Companies
| Debswana | Materials, Metals & Mining |
|---|---|
| Botswana Power Corporation | Utilities |
| Botswana Telecommunications Corporation | Telecommunication Services |
| BancABC | Financials |
| Choppies | Consumer Staples Distribution & Retail |
| Sefalana | Consumer Staples Distribution & Retail |
| Water Utilities Corporation | Utilities |
Major Trade Partners — Import
| Canada | 6% |
|---|---|
| Unspecified | 6% |
| China | 1% |
| N/A | N/A |
| N/A | N/A |
Source: World Integrated Trade Solution
Major Trade Partners — Export
| Belgium | 23% |
|---|---|
| United Arab Emirates | 26% |
| India | 17% |
| South Africa | 9% |
| Israel | 6% |
Source: World Integrated Trade Solution
Global Finance Rankings & Awards


Data Sources:
UN World Population Prospects
World Inequality Report
S&P Global Ratings
Moody’s
Fitch Ratings
IMF Direction of Trade Statistics (DOTS)
UN Conference on Trade and Development (UNCTAD)
CIA The World Factbook
World Bank’s World Integrated Trade Solution
Forbes Global 2000