Includes historical data for El Salvador’s Gross Domestic Product growth, debt-to-GDP ratio and more, as well as information on trade, banking and financial sector leadership.
Economic Strength Based on Natural Resources And Dollarization
Historically reliant on coffee exports, this nation of approximately 6.4 million, the smallest in Central America, has made strides in diversifying its economy by focusing on growth areas such as tourism, construction, retail and energy. In addition, its strategic proximity to the United States not only serves as a competitive advantage in terms of trade and investment opportunities but also as a significant source of revenue through expatriate remittances.
However, over the past three decades, due to the pervasiveness of gang-related activity, El Salvador has struggled behind its regional peers in attracting foreign investment. Despite recent security improvements, this had yet to translate into substantial new inflows. The country confronts a host of other challenges, including chronic fiscal deficits, inadequate infrastructure, widespread inequality and a scarcity of skilled labor. Additionally, the use of theU.S. dollar as the primary official currency and the lack of control over its monetary policy make El Salvador vulnerable to external economic shocks. The introduction of Bitcoin as an alternative legal tender in 2021 yielded mixed results.
Macroeconomy & Sovereign Data
| Type of Government | Presidential republic |
|---|---|
| Capital | San Salvador |
| Sovereign Ratings |
S&P: B– Moody’s: Caa3 Fitch: CCC+ |
| Total Population | 6.4 million |
| Median Age | 27.6 |
| Adult Per Capita Income (PPP) | 15,020.77 |
| Total GDP (2023) | 35.3 billion |
El Salvador GDP & Economic Overview
Most Recent Content
El Salvador

Winner Insights
Banco Cuscatlan Driving Innovations In Latin America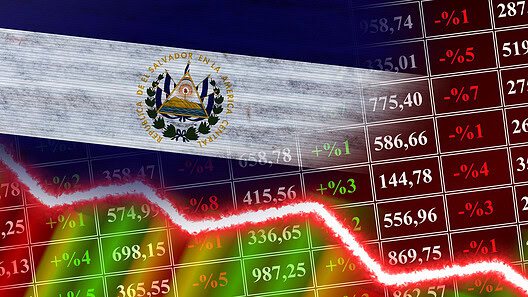
Technology
El Salvador Now Offering Digital Assets
Economics, Policy & Regulation
Latin America Adopts Dual Currencies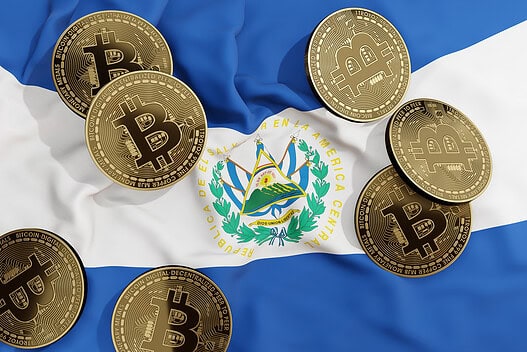
Economics, Policy & Regulation
El Salvador Alters Bitcoin PolicyBanking & Finance
Trade & Investment
| Total Exports | USD 12.7 billion (2023) |
|---|---|
| Leading Exports |
Clothing Electrical Capacitors Plastic Lids Sugar Packaged Medicines Toilet Paper |
| Total Imports | USD 7.7 billion (2022) |
| Leading Imports |
Refined Petroleum Packaged Medicines Clothing Broadcasting Equipment Natural Gas |
| Source: | World Integrated Trade Solution |
El Salvador Leading Companies
| Banco Agrícola | Financials |
|---|---|
| Grupo Calleja | Consumer Staples Distribution & Retail |
| Grupo Poma | Conglomerates, Consumer Discretionary, Real Estate, Telecommunications |
| Telecorporación Salvadoreña (TCS) | Media, Broadcasting |
| La Prensa Gráfica | Media, Publishing |
| Almacenes Simán | Consumer Staples Distribution & Retail |
Major Trade Partners — Import
| United States | 28% |
|---|---|
| China | 17% |
| Guatemala | 10% |
| Mexico | 8% |
| Honduras | 6% |
Major Trade Partners — Export
| United States | 41% |
|---|---|
| Guatemala | 17% |
| Honduras | 17% |
| Nicaragua | 7% |
| Costa Rica | 4% |
Global Finance Rankings & Awards


Data Sources:
UN World Population Prospects
World Inequality Report
S&P Global Ratings
Moody’s
Fitch Ratings
IMF Direction of Trade Statistics (DOTS)
UN Conference on Trade and Development (UNCTAD)
CIA The World Factbook
World Bank’s World Integrated Trade Solution
Forbes Global 2000