
Includes historical data for Ghana’s Gross Domestic Product growth, debt-to-GDP ratio and more, as well as information on trade, banking and financial sector leadership.
Political Stability And Mineral Wealth Underpin Economic Strength
Situated on the Atlantic Ocean and bordered by Togo, Côte d’Ivoire and Burkina Faso, Ghana is known for its stable multi-party democracy, independent judiciary and active civil society, consistently ranking among the top African countries for freedom of speech and press. Ghana has a market-based system and welcomes foreign investment. Its primary commodities—gold, cocoa, and more recently, oil and gas—are the cornerstone of its economy and have fueled significant economic growth.
However, Ghana faces several challenges. Its economy’s dependence on primary commodities makes it vulnerable to global downturns and price fluctuations. The fragile banking sector, burdensome bureaucracy and lack of transparency, infrastructure gaps and intermittent power and water supply, further stifle economic progress and hinder private sector initiatives. Additionally, security threats, including jihadist infiltration in the north and separatist tendencies on the eastern border with Togo, add to the country’s difficulties.
Macroeconomy & Sovereign Data
| Type of Government | Presidential republic |
|---|---|
| Capital | Accra |
| Sovereign Ratings |
S&P: Selective default Moody’s: Ca Fitch: Restricted default |
| Total Population | 33.7 million |
| Median Age | 20.9 |
| Adult Per Capita Income (PPP) | 10,925.84 |
| Total GDP (2023) | 75.2 billion |
Ghana GDP & Economic Overview
Most Recent Content
Ghana

Capital Raising & Corporate Finance
Ghana: New Rules Shake Gold Trade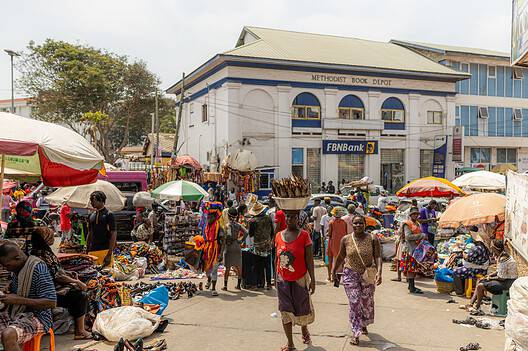
Emerging & Frontier Markets
Ghana: Waiting for FDI
Economics, Policy & Regulation
Central Banker Report Cards 2024: Africa And The Middle East
Capital Raising & Corporate Finance
Ghana: Domestic Funding For CocoaBanking & Finance
Trade & Investment
| Total Exports | USD 21.4 billion (2023) |
|---|---|
| Leading Exports |
Gold Crude Petroleum Cocoa Products Cashews Manganese |
| Total Imports | USD 23.6 billion (2022) |
| Leading Imports |
Refined Petroleum Cars Rice Delivery Trucks Iron |
| Source: | World Integrated Trade Solution |
Ghana Leading Companies
| GCB Bank | Financials |
|---|---|
| Ghana Oil | Oil & Gas Distribution & Marketing |
| Gold Fields Ghana | Materials, Metals & Mining |
| Ashanti Goldfields | Materials, Metals & Mining |
| Wilmar Africa | Consumer Staples Distribution & Retail |
| Volta River Authority | Utilities |
| Accra Brewery Company | Consumer Staples, Brewers |
Major Trade Partners — Import
| China | 18% |
|---|---|
| United States | 9% |
| United Kingdom | 7% |
| India | 6% |
| Belgium | 5% |
Source: World Integrated Trade Solution
Major Trade Partners — Export
| China | 17% |
|---|---|
| Switzerland | 15% |
| India | 14% |
| South Africa | 12% |
| Netherlands | 6% |
Source: World Integrated Trade Solution
Global Finance Rankings & Awards


Data Sources:
UN World Population Prospects
World Inequality Report
S&P Global Ratings
Moody’s
Fitch Ratings
IMF Direction of Trade Statistics (DOTS)
UN Conference on Trade and Development (UNCTAD)
CIA The World Factbook
World Bank’s World Integrated Trade Solution
Forbes Global 2000