Includes historical data for Iceland’s Gross Domestic Product growth, debt-to-GDP ratio and more, as well as information on trade, banking and financial sector leadership.
Economy Powered By Renewables And A Highly Educated Workforce
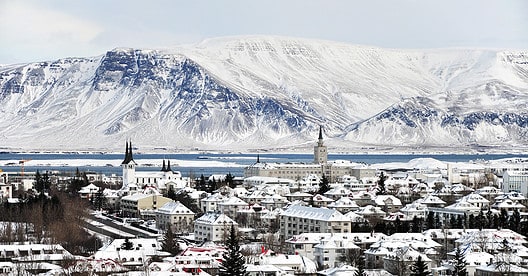
Situated between North America and Europe in the Atlantic Ocean, this country of approximately 400,000 people boasts an advanced economy primarily centered on tourism, fisheries and aluminum production. Incentives, open-market policies,and regulatory efficiency attract significant foreign investment, and have helped diversifying and expanding the economy into sectors such as information technology, creative industries, manufacturing and life sciences. Additionally, Iceland boasts a highly educated and English-proficient workforce, a high standard of living and low social inequality, and a renewable energy grid that derives 99% of its power from geothermal and hydropower sources. Despite not being a member, Iceland is highly integrated into the European Union via the Agreement on the European Economic Area.
However, Iceland faces challenges, including a small domestic market, rigid labor regulations, and exports still disproportionately concentrated on aluminum and fishing products. Volcanic and seismic risks pose further concerns.
Macroeconomy & Sovereign Data
| Type of Government | Unitary parliamentary republic |
|---|---|
| Capital | Reykjavik |
| Sovereign Ratings |
S&P: A Moody’s: A2 Fitch: A |
| Total Population | 400,000 |
| Median Age | 36.8 |
| Adult Per Capita Income (PPP) | 76,195.99 |
| Total GDP (2023) | 33.4 billion |
Iceland GDP & Economic Overview
Most Recent Content
Iceland
Economics, Policy & Regulation
Central Banker Report Cards 2024: Europe

Features
Iceland: Rebuilding TrustBanking & Finance
Trade & Investment
| Total Exports | USD 8.7 billion (2023) |
|---|---|
| Leading Exports |
Aluminum And Aluminum Products Fish Fillets Salmon Iron Alloys Animal Meal |
| Total Imports | USD 7.8 billion (2022) |
| Leading Imports |
Refined Petroleum Aluminum Oxide Carbon/Graphite Electronics Cars Packaged Medicines |
| Source: | World Integrated Trade Solution |
Iceland Leading Companies
| Arion Bank | Financials |
|---|---|
| Kvika Banki | Financials |
| Íslandsbanki | Financials |
| Marel | Industrials, Food Processing Equipment |
| Alvotech | Pharmaceuticals, Biotechnology & Life Sciences |
| Sildarvinnslan | Consumer Staples, Food Products |
| Icelandair | Airlines |
Major Trade Partners — Import
| Norway | 10% |
|---|---|
| China | 9% |
| Germany | 9% |
| United States | 8% |
| Denmark | 8% |
Source: World Integrated Trade Solution
Major Trade Partners — Export
| Netherlands | 27% |
|---|---|
| Spain | 12% |
| United Kingdom | 10% |
| France | 8% |
| United States | 8% |
Source: World Integrated Trade Solution
Global Finance Rankings & Awards


Data Sources:
UN World Population Prospects
World Inequality Report
S&P Global Ratings
Moody’s
Fitch Ratings
IMF Direction of Trade Statistics (DOTS)
UN Conference on Trade and Development (UNCTAD)
CIA The World Factbook
World Bank’s World Integrated Trade Solution
Forbes Global 2000