Includes historical data for Mali’s Gross Domestic Product growth, debt-to-GDP ratio and more, as well as information on trade, banking and financial sector leadership.
Economic Potential Undermined By Mismanagement
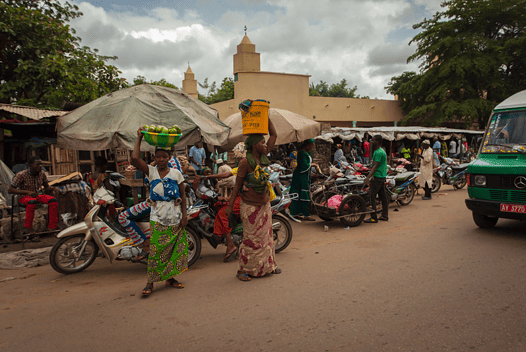
A landlocked country in West Africa, Mali is one of the largest and most impoverished on the continent. Following its independence from France in 1960, a one-party socialist system was followed in 1968 by a military dictatorship lasting for 23 years. Democratic elections were held in 1992. However, in 2020 and 2021, two coups overthrew the civilian government.
With an agriculturally-based and poorly diversified economy exposed to fluctuations in commodity prices and climate shocks, Mali remains heavily dependent on international aid. Corruption, poor legal and physical infrastructure, ongoing security risks, and a lack of skilled labor hinder economic diversification and private-sector dynamism.
Macroeconomy & Sovereign Data
| Type of Government | Semi-presidential republic |
|---|---|
| Capital | Bamako |
| Sovereign Ratings |
S&P: Not rated Moody’s: Caa2 Fitch: Rating watch |
| Total Population | 24.1 million |
| Median Age | 15.4 |
| Adult Per Capita Income (PPP) | 5,748.40 |
| Total GDP (2023) | 21.7 billion |
Mali GDP & Economic Overview
Most Recent Content
Mali
Emerging & Frontier Markets
Mali: A Cautionary TaleCapital Raising & Corporate Finance
ANNUAL SURVEY: WORLD’S BEST BANKS 2014Awards
BEST BANKS 2014: AFRICA
Banking & Finance
Trade & Investment
| Total Exports | USD 7.9 billion (2023) |
|---|---|
| Leading Exports |
Gold Cotton Sesame Seeds Lumber Refined Petroleum |
| Total Imports | USD 8.0 billion (2022) |
| Leading Imports |
Refined Petroleum Clothing And Apparel Packaged Medicines Cement Broadcasting Equipment |
| Source: | World Integrated Trade Solution |
Mali Leading Companies
| La Banque Malienne De Solidarité | Financials |
|---|---|
| Sotelma | Telecommunication Services |
| Compagnie Malienne pour le Développement des Textiles | Consumer Durables, Textiles |
| Société d'Exploitation Minière de Sadiola | Materials, Metals & Mining |
| Energie du Mali | Utilities |
| Mali Shi | Utilities |
Major Trade Partners — Import
| Senegal | 23% |
|---|---|
| China | 16% |
| Côte d'Ivoire | 11% |
| France | 8% |
| India | 3% |
Source: World Integrated Trade Solution
Major Trade Partners — Export
| South Africa | 36% |
|---|---|
| Switzerland | 36% |
| Bangladesh | 7% |
| Côte d'Ivoire | 4% |
| Burkina Faso | 3% |
Source: World Integrated Trade Solution
Global Finance Rankings & Awards


Data Sources:
UN World Population Prospects
World Inequality Report
S&P Global Ratings
Moody’s
Fitch Ratings
IMF Direction of Trade Statistics (DOTS)
UN Conference on Trade and Development (UNCTAD)
CIA The World Factbook
World Bank’s World Integrated Trade Solution
Forbes Global 2000