
Includes historical data for Senegal’s Gross Domestic Product growth, debt-to-GDP ratio and more, as well as information on trade, banking and financial sector leadership.
Political Stability Underpins Economic Growth
The West African nation has earned a reputation for its stable democracy, sustained economic growth, and relatively diversified and open economy. Over the past decade, Senegal has pursued an ambitious development program aimed at increasing investment in strategic industries, enhancing private sector competitiveness and creating job opportunities. As a member of the West African Monetary Union (WAEMU) the country benefits from a degree of monetary stability, while three Special Economic Zones provide investors with tax exemptions and other incentives.
Despite these advantages, Senegal faces significant challenges. Burdensome and unpredictable tax and bureaucratic hurdles, an inefficient judicial system, inadequate access to financing, and a rigid labor market constrain the country’s competitiveness. High levels of unemployment and underemployment, particularly among the educated youth, pose long-term social and economic challenges. Furthermore, with the large agricultural sector employing about 70% of the workforce, the economy is vulnerable to climatic hazards and fluctuations in commodity prices.
Macroeconomy & Sovereign Data
| Type of Government | Presidential republic |
|---|---|
| Capital | Dakar |
| Sovereign Ratings |
S&P: B+ Moody’s: Ba3 Fitch: Not rated |
| Total Population | 18.7 million |
| Median Age | 18.2 |
| Adult Per Capita Income (PPP) | 7,939.61 |
| Total GDP (2023) | 35.5 billion |
Senegal GDP & Economic Overview
Most Recent Content
Senegal

Economics, Policy & Regulation
Senegal: Natural Resource Audit Makes Foreign Operators Nervous
Economics, Policy & Regulation
Senegal: Turmoil Gives Way To A New President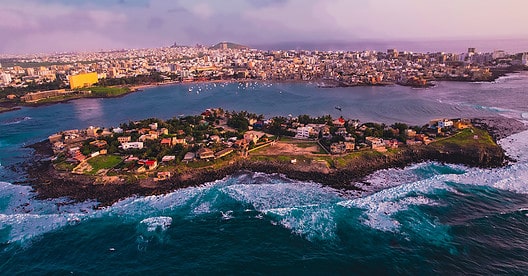
Emerging & Frontier Markets
Senegal: Island Of Opportunity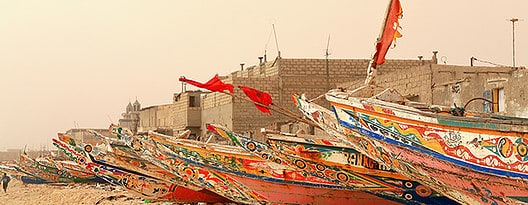
Emerging & Frontier Markets
Senegal: Strength In DiversityBanking & Finance
Trade & Investment
| Total Exports | USD 18.9 billion (2023) |
|---|---|
| Leading Exports |
Gold Refined Petroleum Phosphoric Acid Fish Ground Nuts |
| Total Imports | USD 6.7 billion (2022) |
| Leading Imports |
Refined Petroleum Crude Petroleum Rice Cars Malt Extract Clothing And Apparel |
| Source: | World Integrated Trade Solution |
Senegal Leading Companies
| Société Africaine de Raffinage | Integrated Oil & Gas |
|---|---|
| Senelec | Utilities |
| Industries Chimiques du Sénégal | Materials, Metals & Mining |
| Asecna | Transportation & Logistics |
| Sonatel | Telecommunication Services |
| Eiffage Sénégal | Construction & Engineering |
| Compagnie Sucrière Sénégalaise | Consumer Staples, Food Products |
Major Trade Partners — Import
| France | 12% |
|---|---|
| China | 10% |
| India | 7% |
| Russia | 6% |
| Nigeria | 5% |
Source: World Integrated Trade Solution
Major Trade Partners — Export
| Mali | 20% |
|---|---|
| Switzerland | 14% |
| India | 10% |
| China | 7% |
| Côte d'Ivoire | 4% |
Source: World Integrated Trade Solution
Global Finance Rankings & Awards


Data Sources:
UN World Population Prospects
World Inequality Report
S&P Global Ratings
Moody’s
Fitch Ratings
IMF Direction of Trade Statistics (DOTS)
UN Conference on Trade and Development (UNCTAD)
CIA The World Factbook
World Bank’s World Integrated Trade Solution
Forbes Global 2000