Includes historical data for South Sudan’s Gross Domestic Product growth, debt-to-GDP ratio and more, as well as information on trade, banking and financial sector leadership.
Post-War Instability Undermines Economic Potential
Splitting from South Sudan after a brutal, decades-long civil war, Sudan became the newest internationally recognized country and member of the United Nations in 2011. However, independence did not bring peace to this landlocked nation in Northeast Africa, which remains mired in political instability and intercommunal conflict, consistently ranking as the world’s poorest country by GDP per capita.
Its economy heavily relies on oil and subsistence agriculture, with poor governance and pervasive corruption hindering economic progress, diversification, and the equitable distribution of benefits. The sizable informal sector serves as a vital source of employment. Additionally, Sudan faces challenges exacerbated by climate change and natural disasters, compounding its humanitarian crisis and thwarting development efforts.
Macroeconomy & Sovereign Data
| Type of Government | Presidential republic |
|---|---|
| Capital | Juba |
| Sovereign Ratings |
S&P: Not rated Moody’s: Not rated Fitch: Not rated |
| Total Population | 15.5 million |
| Median Age | 17.1 |
| Adult Per Capita Income (PPP) | 1,689.61 |
| Total GDP (2023) | 6.5 billion |
South Sudan GDP & Economic Overview
Most Recent Content
South Sudan
Economic Data
Poorest Countries in the World 2025
Emerging & Frontier Markets
South Sudan: Risk Equation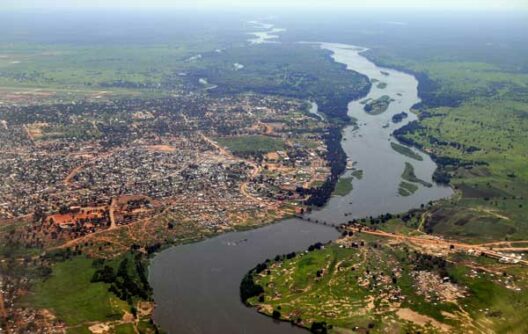
Banking & Finance
Trade & Investment
| Total Exports | USD 1.2 billion (2023) |
|---|---|
| Leading Exports |
Crude Petroleum Gold Forage Crops Lumber Insect Resins |
| Total Imports | USD 0.6 billion (2022) |
| Leading Imports |
Cars Delivery Trucks Packaged Medicines Foodstuffs Clothing And Apparel |
| Source: | World Integrated Trade Solution |
South Sudan Leading Companies
| Nile Commercial Bank | Financials |
|---|---|
| Ivory Bank | Financials |
| Nile Petroleum Corporation | Integrated Oil & Gas |
| Akon Refinery Company | Oil & Gas Refining & Marketing |
| South Sudan Electricity Corporation | Utilities |
| Green Horizon | Consumer Staples, Food Products |
Global Finance Rankings & Awards


Data Sources:
UN World Population Prospects
World Inequality Report
S&P Global Ratings
Moody’s
Fitch Ratings
IMF Direction of Trade Statistics (DOTS)
UN Conference on Trade and Development (UNCTAD)
CIA The World Factbook
World Bank’s World Integrated Trade Solution
Forbes Global 2000