Includes historical data for the Bahamas’ Gross Domestic Product growth, debt-to-GDP ratio and more, as well as information on trade, banking and financial sector leadership.
Economy Dependent On Tourism
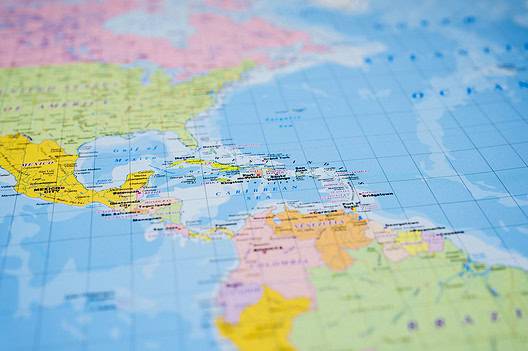
The Bahamas, an archipelago of 700 islands and islets spanning from Florida to Haiti, heavily relies on tourism, which contributes to 70% of its GDP and employs over half of its workforce. A stable democratic tradition, an English-speaking labor force and respect for the rule of law contribute to a conducive investment climate. Robust financial services infrastructure and a strong consumer base further enhance its appeal.
However, challenges persist. The Bahamas is overwhelmingly dependent on the US economy for its international trade, foreign direct investment and expatriate remittances. The nation also grapples with issues such as high energy costs, bureaucratic complexities and lack of transparency, high informality in the economy and inequality rates among its population. Additionally, it faces vulnerability to climatic events like hurricanes and tropical storms.
Macroeconomy & Sovereign Data
| Type of Government | Parliamentary democracy under a constitutional monarchy; a Commonwealth realm |
|---|---|
| Capital | Nassau |
| Sovereign Ratings |
S&P: B+ Moody’s: B1 Fitch: Not rated |
| Total Population | 408,000 |
| Median Age | 33.6 |
| Adult Per Capita Income (PPP) | 46,331.69 |
| Total GDP (2023) | 14.4 billion |
The Bahamas GDP & Economic Overview
Most Recent Content
The Bahamas
Economics, Policy & Regulation
Central Banker Report Cards 2024: The Americas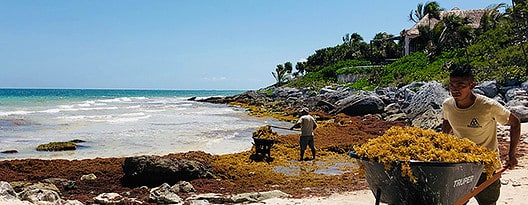

Emerging & Frontier Markets
The Bahamas: Tiny Islands Of OpportunityBanking & Finance
Trade & Investment
| Total Exports | USD 10.1 billion (2023) |
|---|---|
| Leading Exports |
Refined Petroleum Ships Aluminum Lobsters And Crawfish Styrene Polymers |
| Total Imports | USD 4.1 billion (2022) |
| Leading Imports |
Refined Petroleum Ships Aircraft Crude Petroleum Floating Docks |
| Source: | World Integrated Trade Solution |
The Bahamas Leading Companies
| Commonwealth Bank | Financials |
|---|---|
| Bank of The Bahamas | Financials |
| Aliv | Telecommunication Services |
| Bahamasair | Airlines |
| Graycliff Cigar Company | Consumer Staples, Tobacco |
| Ams Food | Food & Staples Retailing |
| The Tribune Media Group | Media, Publishing |
Major Trade Partners — Import
| United States | 80% |
|---|---|
| Unspecified | 3% |
| Canada | 2% |
| Turks and Caicos Islands | 2% |
| China | 2% |
Major Trade Partners — Export
| United States | 79% |
|---|---|
| Unspecified | 8% |
| France | 6% |
| Turks and Caicos Islands | 4% |
| United Kingdom | 1% |
Global Finance Rankings & Awards


Data Sources:
UN World Population Prospects
World Inequality Report
S&P Global Ratings
Moody’s
Fitch Ratings
IMF Direction of Trade Statistics (DOTS)
UN Conference on Trade and Development (UNCTAD)
CIA The World Factbook
World Bank’s World Integrated Trade Solution
Forbes Global 2000