Includes historical data for Zambia’s Gross Domestic Product growth, debt-to-GDP ratio and more, as well as information on trade, banking and financial sector leadership.
High Poverty Levels Combined With Substantial Natural Wealth
A landlocked country in southern Africa, unlike many of its neighbors, Zambia has mostly enjoyed political stability since gaining independence from Britain in 1964. The country boasts significant mining production, agricultural wealth, a substantial share of hydroelectric power generation, and a growing tourism sector. Still, Zambia has also struggled to reach its full economic potential and remains plagued by some of the highest levels of poverty and income inequality in the world.
Some positive progress has been made since 2021, when President Hakainde Hichilema won on a platform of democratic reforms, economic revitalization, and anti-corruption efforts, marking a significant departure from the authoritarian rule of his predecessor, Edgar Lungu. However, cumbersome administrative procedures, lack of transparency, inadequate infrastructure, and a shortage of skilled labor continue to discourage private sector investment. Over-reliance on mining and extractive industries for exports and government revenue, unsustainable external debt levels, and vulnerability to climate change compound the country’s problems.
Macroeconomy & Sovereign Data
| Type of Government | Presidential republic |
|---|---|
| Capital | Lusaka |
| Sovereign Ratings |
S&P: Selective default Moody’s: Ca Fitch: Restricted default |
| Total Population | 21.1 million |
| Median Age | 17.5 |
| Adult Per Capita Income (PPP) | 8,017.72 |
| Total GDP (2023) | 29.8 billion |
Zambia GDP & Economic Overview
Most Recent Content
Zambia
Economics, Policy & Regulation
Central Banker Report Cards 2024: Africa And The Middle East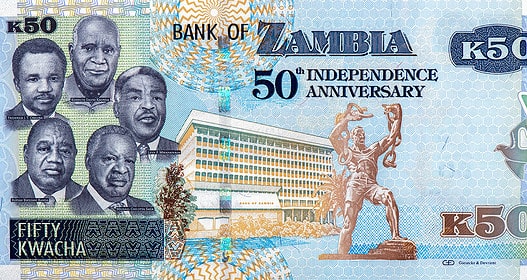
Economics, Policy & Regulation
Zambia: An End To Three-Year Debt Crisis?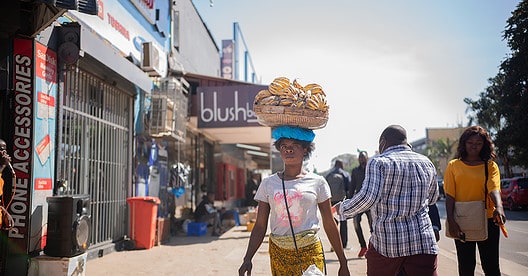
Emerging & Frontier Markets
Zambia: Diversifying FDI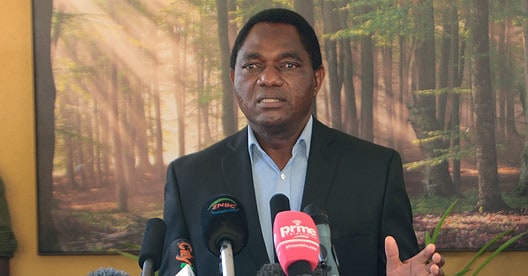
Banking & Finance
Trade & Investment
| Total Exports | USD 6.7 billion (2023) |
|---|---|
| Leading Exports |
Copper Gold Gemstones Tobacco Cement |
| Total Imports | USD 11.5 billion (2022) |
| Leading Imports |
Copper Petroleum Fertilizers Packaged Medicines Delivery Trucks |
| Source: | World Integrated Trade Solution |
Zambia Leading Companies
| Zambia National Commercial Bank | Financials |
|---|---|
| ZCCM Investments Holdings | Materials, Metals & Mining |
| CEC Africa Investments | Utilities, Renewable Electricity |
| Zambia Sugar | Consumer Staples, Food Products |
| Zamtel | Telecommunication Services |
| Zesco | Utilities |
| Zambeef | Consumer Staples, Food Products |
Major Trade Partners — Import
| South Africa | 31% |
|---|---|
| China | 6% |
| India | 6% |
| United Arab Emirates | 6% |
| Democratic Republic of the Congo | 5% |
Source: World Integrated Trade Solution
Major Trade Partners — Export
| Switzerland | 42% |
|---|---|
| China | 19% |
| Singapore | 14% |
| Democratic Republic of the Congo | 10% |
| South Africa | 3% |
Source: World Integrated Trade Solution
Global Finance Rankings & Awards


Data Sources:
UN World Population Prospects
World Inequality Report
S&P Global Ratings
Moody’s
Fitch Ratings
IMF Direction of Trade Statistics (DOTS)
UN Conference on Trade and Development (UNCTAD)
CIA The World Factbook
World Bank’s World Integrated Trade Solution
Forbes Global 2000