World economic growth is slowing down and could result in a synchronized recession.

Last October, the International Monetary Fund (IMF) predicted that the world economy would grow 4.9% in 2022. After almost two years marked by the pandemic, it was a welcome sign of a gradual return to normality. In its bi-annual report, the IMF struck some optimistic notes, pointing out that while the pandemic was continuing, so was—albeit unevenly across regions—the economic recovery.
Just six months later, the IMF revised its predictions: no, it said, this year the economy will only grow to 3.6%. The cut—1.3 points less than previously forecast and one of the Fund’s largest since the start of the century—was due in large part (unsurprisingly) to the war in Ukraine.
“The economic effects of the war are spreading far and wide—like seismic waves that emanate from the epicenter of an earthquake—mainly through commodity markets, trade, and financial linkages,” wrote the Director of Research, Pierre-Olivier Gourinchas, in the foreword to the April’s edition of the World Economic Outlook. “Because Russia is a major supplier of oil, gas, and metals, and, together with Ukraine, of wheat and corn, the current and anticipated decline in the supply of these commodities has already driven their prices up sharply. Europe, Caucasus and Central Asia, Middle East and North Africa, and sub-Saharan Africa are most affected. The food and fuel price increases will hurt lower-income households globally—including in the Americas and Asia.”
Granted—courtesy of geopolitical and trade tensions—the world economy was already following a downward trajectory before the war and the pandemic. In 2019, just a few months before Covid-19 upended life as we knew it, the managing director of the IMF, Kristalina Georgieva, warned: “Two years ago, the global economy was in synchronized upswing. Measured by GDP, nearly 75% of the world was accelerating. Today, even more of the world economy is moving in sync. But unfortunately, this time growth is decelerating. To be precise, in 2019 we expect slower growth in nearly 90% of the world.”
Economic downturns have always hit some people harder than others but that inequality has been exacerbated by the pandemic. Inequalities are widening both within advanced and emerging nations and regions.
The IMF has examined economic performance in advanced countries over the last few decades, and found that subnational disparities have risen since the late 1980s. These gaps in per-capita GDP are persistent, increasing over time and can be even larger than differences between countries.
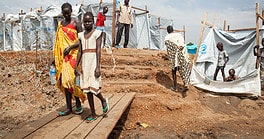
When it comes to economies in poorer regions, they all exhibit similar characteristics that put them at a significant disadvantage when a crisis hits. They tend to be rural, less educated and specialized in traditional sectors such as agriculture, manufacturing and mining, whereas advanced nations are typically more urban, educated and specialized in high productivity growth service sectors such as information technology, finance and communications. Adjustment to adverse shocks is slower and has longer-lived negative repercussions on economic performance, supercharging a corollary of other undesirable effects ranging from high unemployment and a reduced sense of personal well-being. The pandemic and the global food crisis triggered by the war in Ukraine are clear proof of that.
| Region | 2018 | 2019 | 2020 | 2021 | 2022 | 5-Year Avg. GDP % |
|---|---|---|---|---|---|---|
| World | 3.6 | 2.9 | -3.1 | 6.1 | 3.6 | 2.6 |
| Advanced economies | 2.3 | 1.7 | -4.5 | 5.2 | 3.3 | 1.6 |
| Euro area | 1.8 | 1.6 | -6.4 | 5.3 | 2.8 | 1.0 |
| Major advanced economies (G7) | 2.1 | 1.6 | -4.9 | 5.1 | 3.2 | 1.4 |
| Advanced economies excluding G7 and euro area) | 2.8 | 2.0 | -1.8 | 5.0 | 3.1 | 2.2 |
| European Union | 2.2 | 2.0 | -5.9 | 5.4 | 2.9 | 1.3 |
| Emerging market and developing economies | 4.6 | 3.7 | -2.0 | 6.8 | 3.8 | 3.4 |
| Commonwealth of Independent States | 6.4 | 5.3 | -0.8 | 7.3 | 5.4 | 4.7 |
| Emerging and developing Europe | 3.4 | 2.5 | -1.8 | 6.7 | -2.9 | 1.6 |
| ASEAN-5 | 5.4 | 4.9 | -3.4 | 3.4 | 5.3 | 3.1 |
| Latin America and the Caribbean | 1.2 | 0.1 | -7.0 | 6.8 | 2.5 | 0.7 |
| Middle East and Central Asia | 2.7 | 2.2 | -2.9 | 5.7 | 4.6 | 2.4 |
| Sub-Saharan Africa | 3.3 | 3.1 | -1.7 | 4.5 | 3.8 | 2.6 |
The Gross Domestic Product of a country can be defined as the total monetary value of the goods and services produced within its borders in a year. GDP growth is expressed as a percent. The average growth rate has been calculated using the geometric mean to obtain a 5-year equivalent rate.
Source: World Economic Outlook, April 2022.