The tax wedge is the ratio of total labor taxes to total labor costs. It is often lower for families with children and single parents with children than for individuals or couples without children. The tax wedge has an impact on employment growth.
One common method of evaluating tax differentials between countries is by comparing marginal tax rates.
Another point of comparison is the tax wedge.
In its simplest form, the tax wedge is the difference between the net earnings that a worker takes home at the end of the year and what it costs to employ that worker. The World Bank defines it as the ratio of total labor taxes to total labor costs.
For the employer, this includes the employee’s salary and employer social security contributions—such as healthcare and pension contributions. For the employee, the negative balance includes income tax and employee social security payments, and the positive balance includes taxable income salary and other cash benefits.
But the tax wedge is also affected by a number of other factors, including marital status, spouse’s earnings and having children. Many countries offer fiscal advantages to families or single parents, and often the lowest tax wedge will be for single parents with a low salary and with two or more children.
According to research in OECD countries, there is a negative relationship between the size of the tax wedge and employment: as the tax wedge increases, employment growth figures go down. The World Bank found, in a 2005 study of the EU8 countries (the eight Eastern European countries that joined the Union in 2004— Czech Republic, Estonia, Hungary, Latvia, Lithuania, Poland, the Slovak Republic and Slovenia) that for each 1% increase in the tax wedge, there was an associated 0.5%-0.8% drop in employment growth figures. Between 2008 and 2009, many countries reduced the tax wedge for some—or all—taxpayers, which may help contribute to stimulation of employment figures.
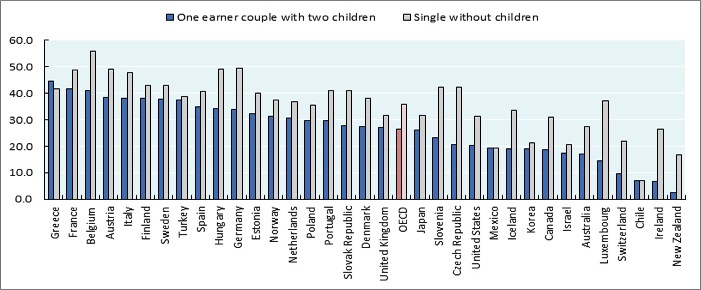
If Chile had the lowest tax wedge in the OECD ranking for a single person (7%) in 2013, New Zealand came right after (16.9%). On the other hand, Germany (49.3%) had the second highest individual tax wedge after Belgium (55.8%.) At the same time, for a one-earner married couple with two children the tax wedge is lowest in New Zealand (2.4%,) and again Chile (7%) and highest in France (41.6%) and then Belgium (41%).
AVERAGE TAX WEDGE AS % OF TOTAL LABOUR COSTS
(Values expressed in percentage)
Country |
Single person at 100% of average earnings,
|
One-earner married couple at 100%
|
|---|---|---|
| Australia | 27.41 | 16.92 |
| Austria | 49.12 | 38.43 |
| Belgium | 55.8 | 41.03 |
| Canada | 31.06 | 18.73 |
| Chile | 7 | 7 |
| Czech Republic | 42.38 | 20.5 |
| Denmark | 38.24 | 27.56 |
| Estonia | 39.9 | 32.31 |
| Finland | 43.12 | 38.08 |
| France | 48.92 | 41.59 |
| Germany | 49.33 | 33.75 |
| Greece | 41.56 | 44.5 |
| Hungary | 49.03 | 34.1 |
| Iceland | 33.45 | 19.09 |
| Ireland | 26.6 | 6.82 |
| Israel | 20.66 | 17.41 |
| Italy | 47.78 | 38.17 |
| Japan | 31.64 | 26.1 |
| Korea | 21.41 | 18.97 |
| Luxembourg | 37.01 | 14.32 |
| Mexico | 19.22 | 19.22 |
| Netherlands | 36.94 | 30.82 |
| New Zealand | 16.89 | 2.41 |
| Norway | 37.34 | 31.18 |
| Poland | 35.56 | 29.82 |
| Portugal | 41.15 | 29.77 |
| Slovak Republic | 41.13 | 27.64 |
| Slovenia | 42.34 | 23.09 |
| Spain | 40.66 | 34.81 |
| Sweden | 42.93 | 37.69 |
| Switzerland | 21.99 | 9.49 |
| Turkey | 38.64 | 37.45 |
| United Kingdom | 31.48 | 27.02 |
| United States | 31.33 | 20.27 |
| OECD – Average | 35.85 | 26.35 |
© OECD 2014