What do people think when they think about the world’s richest countries? And what comes to mind when they think about the world’s smallest countries? Many people would probably be surprised to find that many of the planet’s wealthiest nations are also among the tiniest.
Some very small and very rich countries—like San Marino, Malta, Luxembourg, Switzerland and Singapore—benefit from having sophisticated financial sectors and tax regimes that attract foreign investment, professional talent and large bank deposits. Others like Brunei, Qatar and the United Arab Emirates have large reserves of hydrocarbons or other lucrative natural resources. Shimmering casinos and hordes of tourists are good for business too: Asia’s gambling haven, Macao, endured nearly three years of intermittent lockdowns and pandemic-related travel restrictions, yet it remains one of the most affluent states in the world.
But what do we mean when we say a country is “rich,” especially in an era of growing income inequality between the super-rich and everyone else? While gross domestic product (GDP) measures the value of all goods and services produced in a nation, dividing this output by the number of full-time residents is a better way of determining how rich or poor one country’s population is relative to another’s. The reason why “rich” often equals “small” then becomes clear: these countries’ economies are disproportionately large compared to their small number of inhabitants.
However, only when taking into account inflation rates and the cost of local goods and services can we get a more accurate picture of a nation’s average standard of living: the resulting figure is what is called purchasing power parity (PPP), often expressed in international dollars to allow comparisons between different countries.
Should we then automatically assume that in nations where PPP is particularly high the overall population is visibly better off than in most other places in the world? Not quite. We are dealing with averages and within each country structural inequalities can easily swing the balance in favor of those who are already advantaged.
The COVID-19 pandemic lifted the veil on these disparities in ways few could have predicted. While there is no doubt that the wealthiest nations—often more vulnerable to the coronavirus due to their older population and other risk factors—had the resources to take better care of those in need, those resources were not equally accessible to all. Furthermore, the economic fallout of lockdowns hit low-paid workers harder than those with high-paying occupations and that, in turn, fueled a new kind of inequality between those who could comfortably work from home and those who had to risk their health and safety by traveling to job sites. Those who lost their jobs because their industries shut down entirely found themselves without much of a safety net—large holes in the most celebrated welfare systems in the world were exposed.
Then as the pandemic subsided, inflation surged globally, Russia invaded Ukraine, exacerbating the food and oil price crisis. The Israel-Hamas conflict followed, bringing more disruption to supply chains and commodity and energy markets. Lower-income families always tend to be hit the hardest, as they are forced to spend greater proportions of their incomes on basic necessities—housing, food and transportation—whose prices are more volatile and tend to increase the most.
In the 10 poorest countries in the world, the average per-capita purchasing power is just about $1,600 while in the 10 richest it is over $118,000, according to data from the International Monetary Fund (IMF).
A word of caution about these statistics: the IMF has warned repeatedly that certain numbers should be taken with a grain of salt. For example, many nations in our ranking are tax havens, which means their wealth was originally generated elsewhere, leading to an artificial boost in official GDP figures. While a global deal to ensure that big companies pay a minimum tax rate of 15% was signed in 2021 by more than 130 governments (a deal that has yet to be implemented due to the opposition of legislators and politicians in many of them), critics have argued that this rate is barely higher than that of many tax havens. More than 15% of global jurisdictions are estimated to be tax havens, with about 40% of global foreign direct investment expected to be routed through tax-avoidance channels by the decade’s end. up from about 30% in the 2010s. In other words: these investments pass through empty corporate shells and bring little or no economic gain to the population where the money ends up.

Beyond Speed and Cost: The Push for Transparency in Cross-Border Payments
The 10 Richest Countries In The World
10. United States 🇺🇸
Current International Dollars: 89,105.20
Did we say that the wealthiest countries are also the smallest? That is certainly not the case with the United States, which first entered the top 10 list in 2020 after spending much of the last two decades outside the top tier of the ranking.
Its surge, at least initially, was largely due to pandemic-related socioeconomic measures, which boosted income and spending, and to falling energy prices, which pushed petroleum-based economies down several spots. Still, the country has since managed to build on the momentum and maintain its presence in the highest tier of the list. Will the momentum last? Last year and the one before, the U.S. economy was growing at a pace of about 2.8%. The IMF predictions for the current year and the next are a full percentage point lower, at around 1.8%.

9. Guyana 🇬🇾
Current International Dollars: 94,258.28
Ten years ago, in this very ranking, Guyana would have placed 106th out of about 200 nations tracked by the IMF: its GDP per capita totaled just $11,000. But that was before this nation of 215,000 square kilometers, nestled between Brazil, Suriname, Venezuela and the Atlantic Ocean, struck gold—or oil, to be more precise. In 2015, after one of the largest offshore crude discoveries in decades, Guyana entered the super-exclusive club of oil‑rich nations: once the required infrastructure was set up, on December 20, 2019, it produced its first barrel of oil.
With current output of over 600,000 barrels per day—estimated to grow to almost 940,000 later this year—the windfall has transformed this nation of 800,000 people into one of the richest and fastest‑growing on Earth. Its GDP, currently growing at a yearly pace of about 25%, is estimated to hit 40% by the end of the decade.
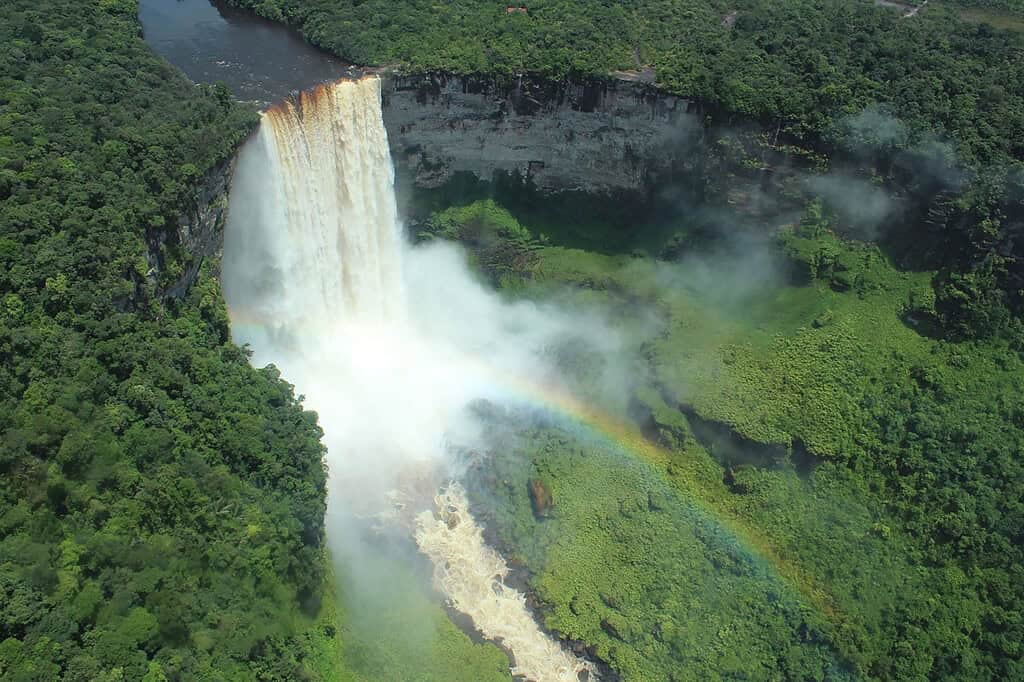
Yet experts have already warned of the so‑called “resource curse,” a pattern in which oil wealth often leads to corruption, rising inequality and authoritarian drift—Venezuela serves as a cautionary tale. Up to this point, however, Guyana has mostly managed to avoid the most serious pitfalls by building a framework that includes mechanisms for audits and public reporting, a sovereign wealth fund, and investments in infrastructure and social programs, earning praise from the IMF.
8. Brunei Darussalam 🇧🇳
Current International Dollars: 95,758.15
1,788 rooms, including 257 bathrooms, a banquet hall that can accommodate up to 5,000 guests, a mosque for 1,500 people, an air-conditioned stable for 200 polo ponies, 5 pools, and 18 elevators: this is where Hassanal Bolkiah, the Sultan of Brunei, lives and gets his habitual $20,000 haircut—although it is not entirely clear whether the price tag includes flying his barber from London or just the spiff-up.
Yet, it is not all roses in the sultanate. Despite the monarch’s opulence and an on-paper per capita purchasing power of over $95,000, malnutrition and undernourishment—especially among children—are not rare occurrences in Brunei, with many families relying on government welfare to get by.
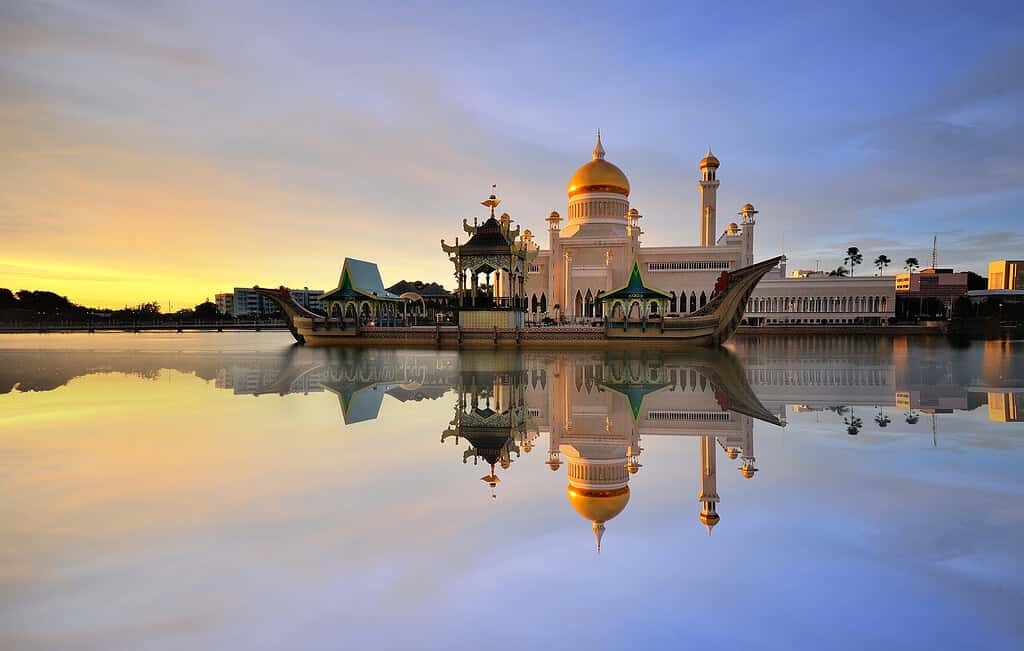
While the country was spared the worst of the pandemic, it was not immune from the pandemic-related plunge in oil prices. After registering a 13-year high of 3.8% economic growth in 2019, the GDP fell to 1.1% in 2020, and into negative territory (–1.6%) in 2021. As a consequence, Brunei fell out of the top 10 richest countries in the world. When oil prices bounced back, so did Brunei: last year, the economy grew by 4%.
7. Switzerland 🇨🇭
Current International Dollars: 97,581.32
White chocolate, the bobsleigh, the Swiss Army knife, the computer mouse, the immersion blender, velcro, and LSD are just some of the noteworthy inventions brought to the world by Switzerland. This country of close to 9 million people owes much of its wealth to banking and insurance services, to tourism, and to the export of pharmaceutical products, gems, precious metals, precision instruments (think watches) and machinery (medical apparatuses and computers).
According to the 2024 Global Wealth Report by UBS, Switzerland once again came out on top when it comes to the mean average wealth per adult at a whopping $709,612. Furthermore, roughly one adult in six owns assets worth more than one million U.S. dollars. Is it really a surprise that Switzerland has the highest density of millionaires in the world?
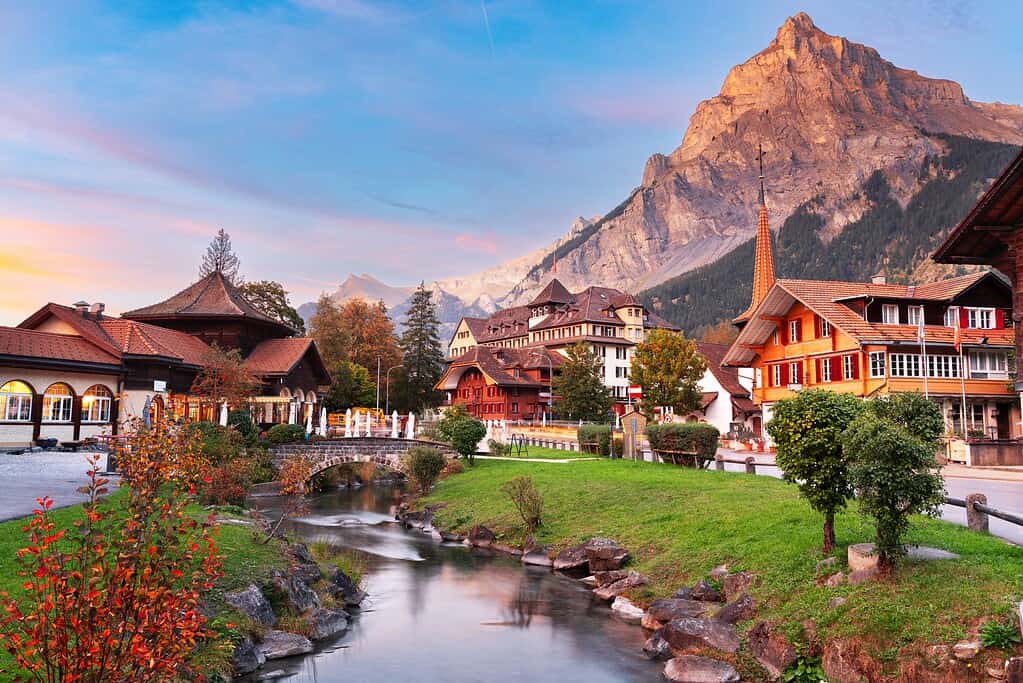
But does that mean Switzerland is immune to economic woes? The country remains resilient, but it is no longer unaffected by global shocks. The pandemic had a significant impact on the economy, and so did—due to the dependence on Russian oil and gas—the war in Ukraine. To make matters worse, in 2022, Credit Suisse nearly imploded before a government-engineered rescue by its long-time rival, UBS Group, pulled it back from the brink. The demise of Credit Suisse has shaken the country, damaging Switzerland’s reputation as a secure and reliable global banking center.
Growth is not great either: in 2021, the economy expanded by 5.57%. Forecasts for this year stand at just 0.87%.
6. Norway 🇳🇴
Current International Dollars: 107,891.95
Since the discovery of large offshore reserves in the late 1960s, Norway’s economic engine has been fueled by oil. As Western Europe’s top petroleum producer, the country has benefited for decades from rising prices.
Until it didn’t: prices crashed at the beginning of 2020, then the global pandemic ensued—and the krone was sent into freefall. In the second quarter of that year, Norwegian GDP fell by 6.3 %, the biggest decline in half a century and possibly since World War II.
Does that mean Norwegians were left significantly less wealthy than they were before the pandemic? Certainly not.
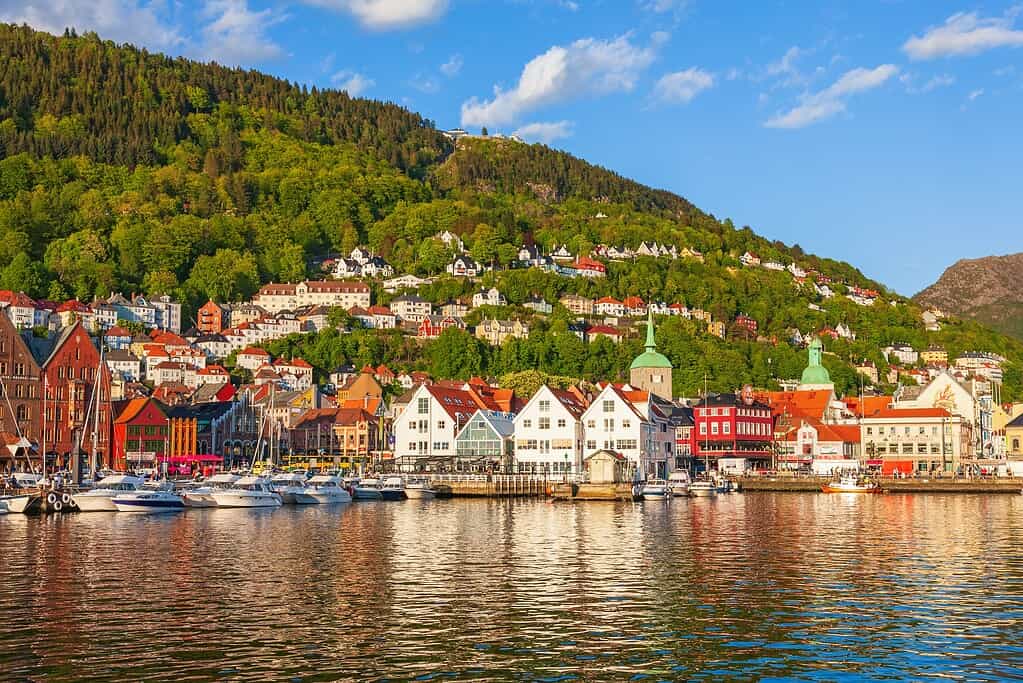
The economy has since pared the losses and rebounded. Further, when it comes to any unforeseen economic problem, Norwegians can always count on their $1.9 trillion sovereign wealth fund, the world’s largest. Not only that, unlike many other rich nations, Norway’s high per capita GDP figures are a reasonably accurate reflection of the average person’s economic well-being. The country boasts one of the smallest income inequality gaps in the world.
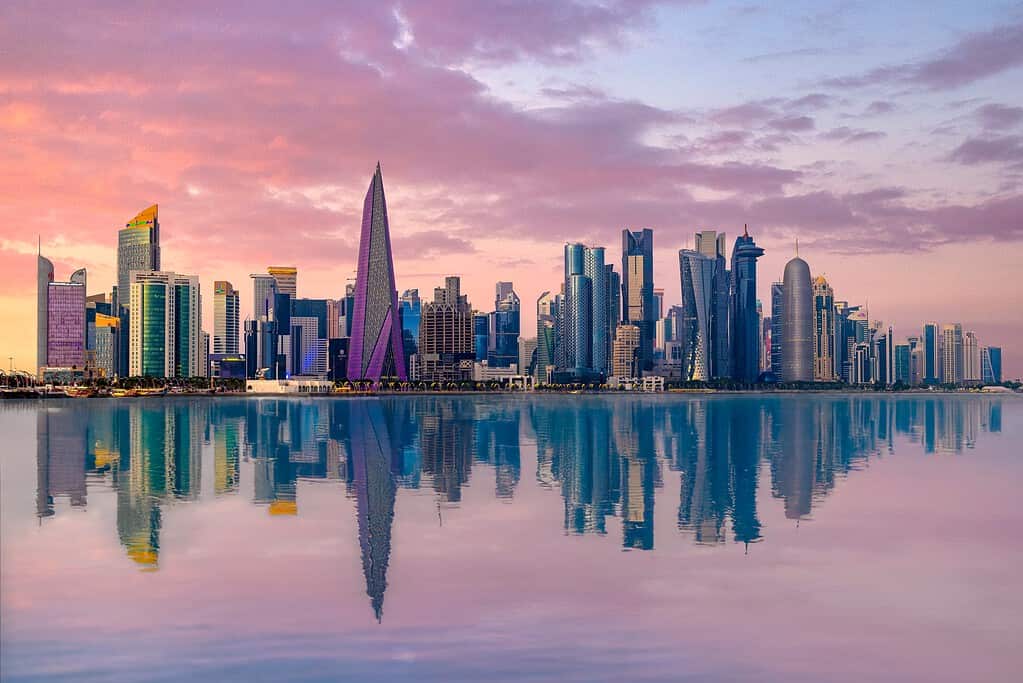
5. Qatar 🇶🇦
Current International Dollars: 121,605.13
Qatar’s oil, gas and petrochemical reserves are so large and its population so small—just a little over 3 million—that this marvel of ultramodern architecture, luxury shopping malls and fine cuisine has managed to stay atop the list of the world’s richest nations for 20 years.
No rich country, however, is without its problems. With only about 12% of the country’s residents being Qatari nationals, the initial months of the pandemic saw Covid-19 spreading rapidly among low-income migrant workers living in crowded quarters, triggering one of the highest rates of positive cases in the region. Then, falling energy prices meant falling government and private sector revenues. An export-oriented economy, Qatar also suffered from the disruption in global trade caused by the war in Ukraine. Later on, the conflict in Gaza sparked renewed fears and uncertainty across the Middle East. Still, the economy has proven to be very resilient. Now at about 2.4%, growth is projected by the IMF to ramp up in the years ahead, to about 5.6% in 2026 and 8% in 2027.
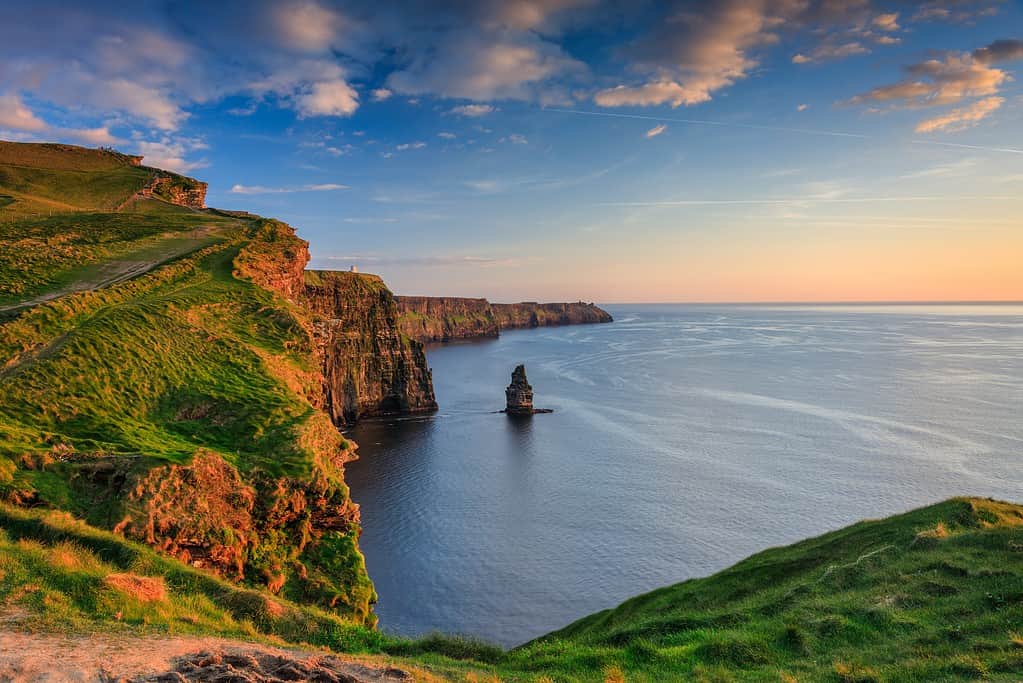
4. Ireland 🇮🇪
Current International Dollars: 133,999.52
A nation of about 5.3 million inhabitants, the Republic of Ireland was one of the hardest hit by the 2008-9 financial crisis. After implementing politically difficult reform measures, including sharp reductions in public-sector salaries and a banking overhaul, the island nation regained its fiscal health, boosted its employment rates and saw its per capita GDP grow exponentially.
However, context is important. As one of the world’s largest corporate tax havens, Ireland’s system disproportionately favors multinational corporations over everyday Irish citizens. Halfway through the 2010s, many large US firms—Apple, Google, Microsoft, Meta and Pfizer to name a few—moved their fiscal residence to Ireland to benefit from its low corporate tax rate of 12.5%, one of the most attractive in the developed world.
In recent years, these multinationals accounted for about 50% of the total value added to the Irish economy. However, now that Ireland has agreed to implement the global minimum corporate tax rate of 15% for large multinational companies, its competitive advantage could erode.
Furthermore, while Irish families are undoubtedly better off than they used to be, the national household per-capita disposable income remains slightly lower than the overall EU average according to data from the OECD. With a considerable gap between the richest and poorest (the top 20% of the population earns almost five times as much as the bottom 20%), most Irish citizens would likely balk at the idea that they are among the richest in the world.
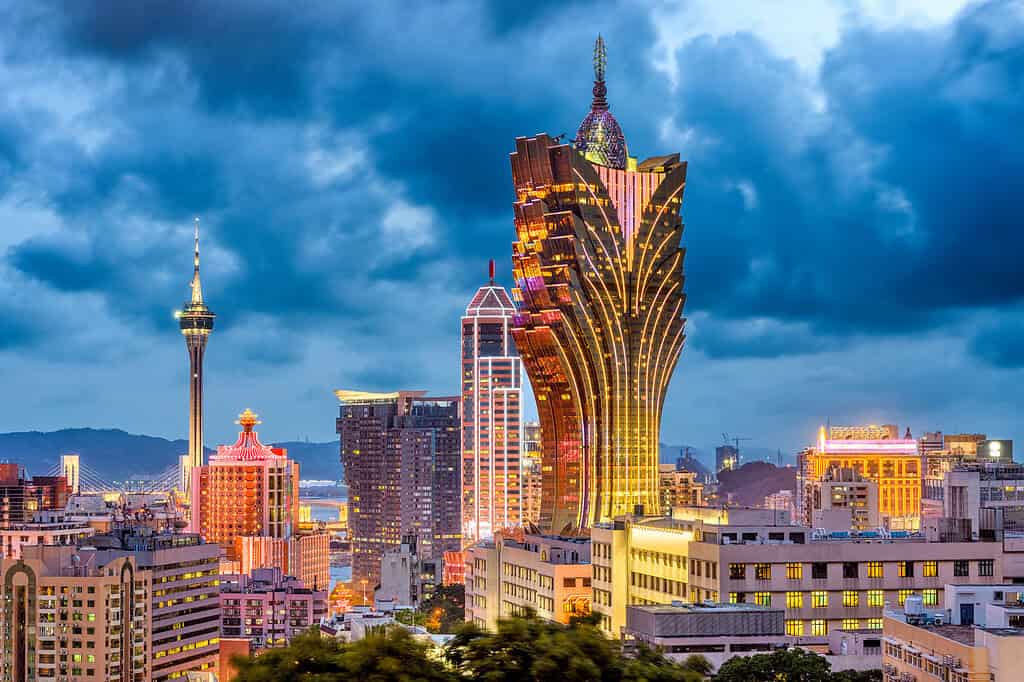
3. Macao SAR 🇲🇴
Current International Dollars: 134,041.95
Just a few years ago, many were betting that the Las Vegas of Asia was on its way to becoming the richest nation in the world—it encountered a few bumps along the road. Formerly a colony of the Portuguese Empire, once the gaming industry was liberalized in 2001, this Special Administrative Region of the People’s Republic of China began seeing its wealth grow at an astounding pace. With a population of about 720,000, and more than 40 casinos spread over a territory of about 30 square kilometers, this narrow peninsula just south of Hong Kong became a money-making machine.
Then, all of a sudden, everything changed. When Covid hit, international travel ground to a halt, and for a while Macao even slipped out of the 10 richest nations ranking. Since then, Macao has returned to business as usual —and then some. Its per-capita purchasing power was about $125,000 in 2019—it is even higher today.
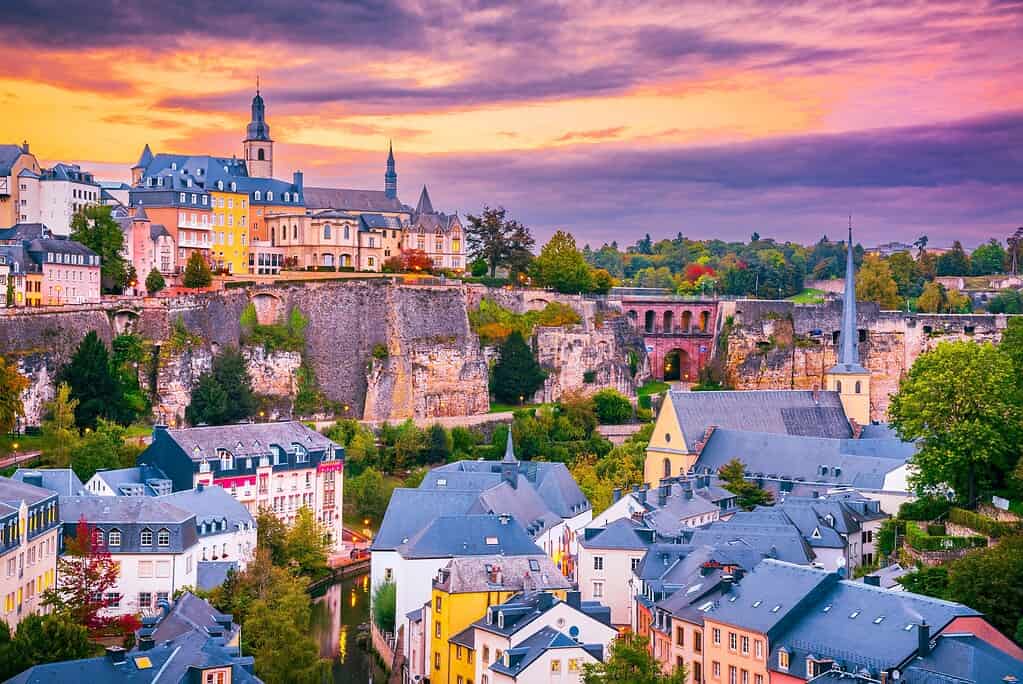
2. Luxembourg 🇱🇺
Current International Dollars: 152,915.41
You can visit Luxembourg for its castles and beautiful countryside, its cultural festivals or gastronomic specialties. Or you could just set up an offshore account through one of its banks and never set foot in the country again. It would be a pity, though: situated at the very heart of Europe, this nation of close to 670,000 people has plenty to offer, both to tourists and citizens. Luxembourg uses a large share of its wealth to deliver better housing, healthcare and education to its people, who by far enjoy the highest standard of living in the Eurozone.
While the global financial crisis and pressure from the EU and OECD to reduce banking secrecy may have had little impact on Luxembourg’s economy, the coronavirus outbreak forced many businesses to close and cost workers their jobs.
Furthermore, due to high interest rates, the war in Ukraine, and a broader deterioration of the economic conditions in the Eurozone, the post-pandemic rebound did not last long: the economy contracted in 2023, grew modestly last year by 1%, and at an estimated 1.5% growth won’t do that much better in 2025.
Still, weak economic growth may not be worth complaining about when your living standards are this high: Luxembourg topped the $100,000 mark in per capita GDP in 2014 and has never looked back ever since.
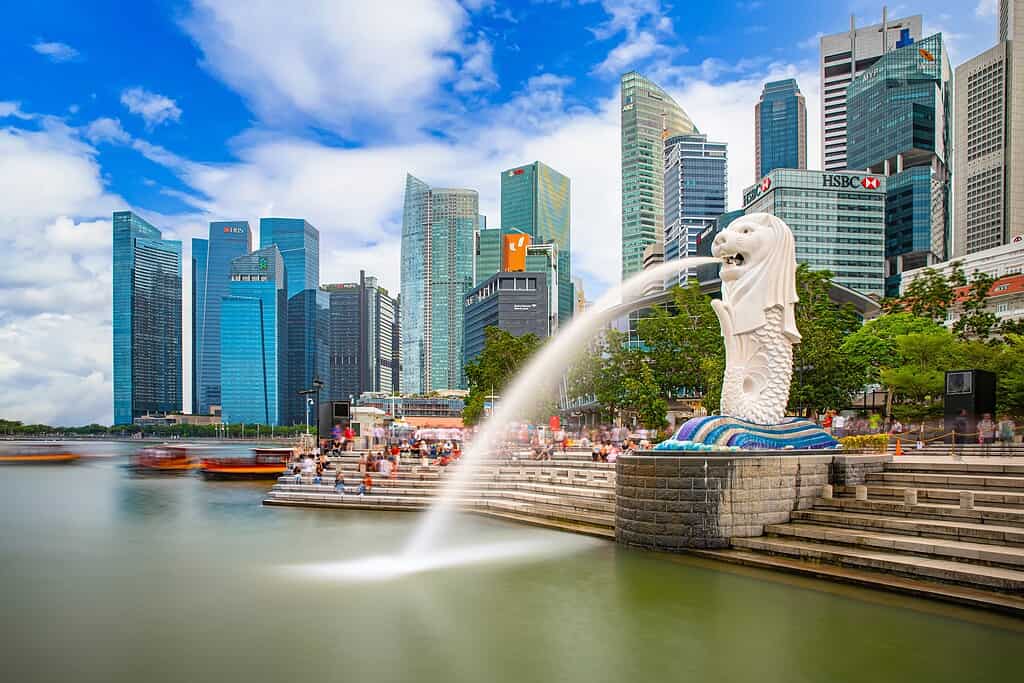
1. Singapore 🇸🇬
Current International Dollars: 156,755.35
With a net worth of over $40 billion, the richest person living in Singapore is an American: Eduardo Saverin, the co-founder of Facebook, who in 2011 left the U.S. with 53 million shares of the company and became a permanent resident of the island nation. Like many other fellow millionaires and billionaires, Saverin did not choose it just for its urban attractions or natural gateways: Singapore is an affluent fiscal haven where capital gains and dividends are tax-free. But how did Singapore manage to attract so many high-net-worth individuals? When the city-state became independent in 1965, one-half of its population was illiterate. With virtually no natural resources, Singapore pulled itself up by its bootstraps through hard work and smart policy, becoming one of the most business-friendly places in the world. Today, Singapore is a thriving trade, manufacturing and financial hub. In an even more welcome development, 98% of the adult population is now literate.
World’s Richest Countries 2025
| Rank | Country/Territory | GDP-PPP per capita ($) |
| 1 | Singapore | 156,755.35 |
| 2 | Luxembourg | 152,915.41 |
| 3 | Macao SAR | 134,041.95 |
| 4 | Ireland | 133,999.52 |
| 5 | Qatar | 121,605.13 |
| 6 | Norway | 107,891.95 |
| 7 | Switzerland | 97,581.32 |
| 8 | Brunei Darussalam | 95,758.15 |
| 9 | Guyana | 94,258.28 |
| 10 | United States | 89,105.20 |
| 11 | Denmark | 88,934.01 |
| 12 | Netherlands | 84,565.84 |
| 13 | Taiwan | 84,082.04 |
| 14 | San Marino | 83,031.15 |
| 15 | United Arab Emirates | 81,031.15 |
| 16 | Iceland | 81,215.00 |
| 17 | Hong Kong SAR | 77,942.14 |
| 18 | Malta | 76,705.14 |
| 19 | Belgium | 75,845.78 |
| 20 | Sweden | 74,902.02 |
| 21 | Austria | 74,371.98 |
| 22 | Germany | 72,599.01 |
| 23 | Australia | 72,137.53 |
| 24 | Andorra | 72,059.15 |
| 25 | Bahrain | 67,794.59 |
| 26 | Finland | 66,496.39 |
| 27 | Canada | 65,706.53 |
| 28 | France | 65,625.57 |
| 29 | Korea | 65,111.90 |
| 30 | Cyprus | 65,088.33 |
| 31 | United Kingdom | 63,660.65 |
| 32 | Italy | 63,075.55 |
| 33 | Saudi Arabia | 61,922.82 |
| 34 | Czech Republic | 59,368.14 |
| 35 | Slovenia | 57,984.88 |
| 36 | Lithuania | 57,195.66 |
| 37 | Spain | 56,435.71 |
| 38 | Israel | 56,435.71 |
| 39 | New Zealand | 55,450.39 |
| 40 | Poland | 55,185.59 |
| 41 | Japan | 54,677.12 |
| 42 | Croatia | 51,441.90 |
| 43 | Kuwait | 50,961.46 |
| 44 | Aruba | 50,895.64 |
| 45 | Puerto Rico | 50,772.35 |
| 46 | Portugal | 50,037.19 |
| 47 | Estonia | 49,671.08 |
| 48 | Russia | 49,382.88 |
| 49 | Romania | 49,212.72 |
| 50 | Hungary | 48,600.28 |
| 51 | Slovak Republic | 47,425.38 |
| 52 | Greece | 45,047.53 |
| 53 | Latvia | 44,563.44 |
| 54 | Kazakhstan | 44,445.67 |
| 55 | Panama | 43,839.19 |
| 56 | Malaysia | 43,437.16 |
| 57 | Turkiye | 42,450.64 |
| 58 | Oman | 42,014.51 |
| 59 | Seychelles | 42,009.46 |
| 60 | Bulgaria | 41,901.15 |
| 61 | The Bahamas | 38,829.27 |
| 62 | Uruguay | 37,060.03 |
| 63 | Maldives | 36,584.59 |
| 64 | Trinidad and Tobago | 36,017.52 |
| 65 | Chile | 35,146.05 |
| 66 | Belarus | 34,312.69 |
| 67 | St. Kitts and Nevis | 34,001.80 |
| 68 | Montenegro | 33,619.80 |
| 69 | Serbia | 33,619.80 |
| 70 | Mauritius | 32,910.82 |
| 71 | Antigua and Barbuda | 31,780.62 |
| 72 | Costa Rica | 31,462.66 |
| 73 | Argentina | 31,379.49 |
| 74 | Dominican Republic | 30,874.49 |
| 75 | Georgia | 30,749.50 |
| 76 | North Macedonia | 29,474.60 |
| 77 | China | 28,978.03 |
| 78 | St. Lucia | 28,840.45 |
| 79 | Turkmenistan | 27,872.80 |
| 80 | Thailand | 26,322.86 |
| 81 | Azerbaijan | 26,235.04 |
| 82 | Mexico | 25,462.86 |
| 83 | Armenia | 25,059.91 |
| 84 | Gabon | 24,908.24 |
| 85 | Albania | 23,404.66 |
| 86 | Barbados | 23,268.80 |
| 87 | Brazil | 23,268.80 |
| 88 | Bosnia and Herzegovina | 22,830.75 |
| 89 | Suriname | 22,438.56 |
| 90 | Colombia | 22,421.03 |
| 91 | Grenada | 21,672.16 |
| 92 | Egypt | 21,667.69 |
| 93 | St. Vincent and the Grenadines | 21,297.74 |
| 94 | Ukraine | 20,998.83 |
| 95 | Mongolia | 20,448.43 |
| 96 | Kosovo | 20,383.31 |
| 97 | Equatorial Guinea | 20,165.07 |
| 98 | Islamic Republic of Iran | 19,957.43 |
| 99 | Moldova | 19,678.00 |
| 100 | Dominica | 19,583.52 |
| 101 | Paraguay | 19,571.31 |
| 102 | Botswana | 19,165.74 |
| 104 | Peru | 18,688.51 |
| 105 | Algeria | 18,525.02 |
| 105 | Palau | 18,344.33 |
| 106 | Libya | 17,757.59 |
| 107 | Bhutan | 17,735.09 |
| 108 | Indonesia | 17,611.82 |
| 109 | Vietnam | 17,484.19 |
| 110 | Fiji | 16,866.95 |
| 111 | Ecuador | 16,577.99 |
| 112 | South Africa | 15,988.72 |
| 113 | Belize | 15,981.77 |
| 114 | Guatemala | 15,633.57 |
| 115 | Iraq | 15,177.83 |
| 116 | Tunisia | 14,778.87 |
| 117 | El Salvador | 13,746.21 |
| 118 | Eswatini | 13,733.51 |
| 119 | Philippines | 12,934.64 |
| 120 | Jamaica | 12,596.68 |
| 121 | Uzbekistan | 12,462.38 |
| 122 | Namibia | 12,372.99 |
| 123 | Cabo Verde | 12,254.67 |
| 124 | India | 12,131.84 |
| 125 | Bolivia | 11,574.10 |
| 126 | Jordan | 11,508.13 |
| 127 | Morocco | 11,266.20 |
| 128 | Nauru | 11,148.59 |
| 129 | Bangladesh | 10,265.13 |
| 130 | Angola | 10,233.73 |
| 131 | Lao P.D.R. | 10,124.67 |
| 132 | Djibouti | 9,414.60 |
| 133 | Nicaragua | 9,106.61 |
| 134 | Kyrgyz Republic | 8,780.52 |
| 135 | Mauritania | 8,653.98 |
| 136 | Cambodia | 8,646.37 |
| 137 | Ghana | 8,416.50 |
| 138 | Venezuela | 8,397.17 |
| 139 | Cote d’Ivoire | 8,111.03 |
| 140 | Tonga | 8,091.10 |
| 141 | Honduras | 7,927.31 |
| 142 | Marshall Islands | 7,695.60 |
| 143 | Samoa | 7,621.02 |
| 144 | Kenya | 7,534.00 |
| 145 | Tuvalu | 7,005.45 |
| 146 | Pakistan | 6,950.55 |
| 147 | Nigeria | 6,792.40 |
| 148 | Republic of Congo | 6,592.93 |
| 149 | Sao Tome and Principe | 6,422.47 |
| 150 | Tajikistan | 6,047.67 |
| 151 | Myanmar | 5,923.89 |
| 152 | Cameroon | 5,759.72 |
| 153 | Nepal | 5,715.25 |
| 154 | Senegal | 5,498.78 |
| 155 | Zimbabwe | 5,407.36 |
| 156 | Timor-Leste | 4,916.98 |
| 157 | Benin | 4,788.48 |
| 158 | Micronesia | 4,768.25 |
| 159 | Guinea | 4,749.27 |
| 160 | Zambia | 4,521.85 |
| 161 | Ethiopia | 4,397.78 |
| 162 | Tanzania | 4,370.56 |
| 163 | Rwanda | 4,103.71 |
| 164 | Comoros | 4,018.23 |
| 165 | Uganda | 3,896.33 |
| 166 | Papua New Guinea | 3,757.17 |
| 167 | Kiribati | 3,707.10 |
| 168 | The Gambia | 3,687.67 |
| 169 | Sierra Leone | 3,549.66 |
| 170 | Togo | 3,473.20 |
| 171 | Lesotho | 3,383.68 |
| 172 | Guinea-Bissau | 3,278.64 |
| 173 | Haiti | 3,042.00 |
| 174 | Chad | 2,987.88 |
| 175 | Vanuatu | 2,986.14 |
| 176 | Burkina Faso | 2,978.14 |
| 177 | Mali | 2,934.12 |
| 178 | Solomon Islands | 2,713.25 |
| 179 | Sudan | 2,335.93 |
| 180 | Niger | 2,095.57 |
| 181 | Madagascar | 2,043.02 |
| 182 | Liberia | 2,005.76 |
| 183 | Somalia | 1,915.71 |
| 184 | Democratic Republic of the Congo | 1,884.15 |
| 185 | Malawi | 1,777.95 |
| 186 | Mozambique | 1,728.85 |
| 187 | Yemen | 1,674.74 |
| 188 | Central African Republic | 1,329.96 |
| 189 | Burundi | 1,015.17 |
| 190 | South Sudan | 716.249 |
| — | Afghanistan Eritrea Lebanon Sri Lanka Syria West Bank and Gaza |
N/A |
Source: International Monetary Fund, World Economic Outlook April 2025. Values are expressed in current international dollars, reflecting the corresponding exchange rates and PPP adjustments.