
Includes historical data for Afghanistan’s Gross Domestic Product growth, debt-to-GDP ratio and more, as well as information on trade, banking and financial sector leadership.
Return of the Taliban
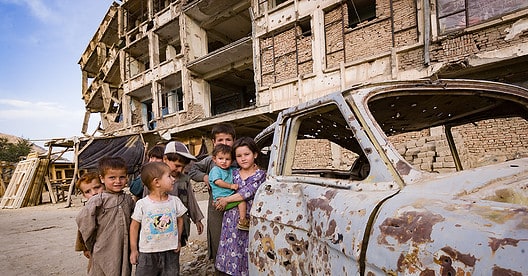
The fall of Afghanistan to the Taliban in 2021 had profound implications for the country’s economy and governance. Labor freedom and business operations have been severely impacted, monetary stability is fragile, and approximately 85% of the population live on less than one dollar a day.
Still, economic policymaking remains primarily focused on financing the ongoing conflict, while the weakened fiscal situation has been further exacerbated by the collapse of oil and tax revenue, the reliance on informal channels for trade and payments, and restrictive policies on women’s work and education. Despite existing legal frameworks, the unstable environment hampers foreign investment, and the economy remains heavily reliant on external support.
Macroeconomy & Sovereign Data
| Type of Government | Theocracy |
|---|---|
| Capital | Kabul |
| Sovereign Ratings | N.A. |
| Total Population | 34.26 million |
| Median Age | 17 |
| Adult Per Capita Income (PPP) | USD 3,131.40 |
| Total GDP (2023) | USD 14.94 billion |
Afghanistan GDP & Economic Overview
Most Recent Content
Afghanistan

Capital Raising & Corporate Finance
Words Of Wisdom: Saad Mohseni, Moby Group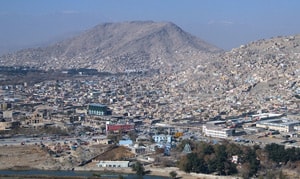
Features
Special Report: Afghanistan
Capital Raising & Corporate Finance
Traditional Trade Finance Instruments Back In FashionBanking & Finance
Trade & Investment
| Total Exports | USD 5.9 billion (2022) |
|---|---|
| Leading Exports |
Gold Figs Grapes Cotton Fruits And Nuts Coal |
| Total Imports | USD 2.8 billion (2022) |
| Leading Imports |
Wheat Flours Broadcasting Equipment Refined Petroleum Rolled Tobacco Aircraft Parts Synthetic Fabrics |
| Source: | IMF, CIA The World Factbook |
Afghanistan Leading Companies
| Afghanistan International Bank | Financials |
|---|---|
| Azizi Bank | Financials |
| Khan Steel Company | Materials |
| Roshan | Telecommunication Services |
| Afghan Wireless Communication | Telecommunication Services |
| Safi Airways | Transportation, Airlines |
| Watan Group | Conglomerates, Construction & Engineering, Telecommunications |
Major Trade Partners — Import
| Islamic Republic of Iran | 14.6% |
|---|---|
| China | 13.9% |
| Pakistan | 12.9% |
| United States | 9.2% |
| Turkmenistan | 8.1% |
Major Trade Partners — Export
| India | 47.1% |
|---|---|
| Pakistan | 34.3% |
| China | 3.6% |
| Türkiye | 2.9% |
| United Arab Emirates | 2.8% |
| Islamic Republic of Iran | 1.7% |
Global Finance Rankings & Awards


Data Sources:
UN World Population Prospects
World Inequality Report
S&P Global Ratings
Moody’s
Fitch Ratings
IMF Direction of Trade Statistics (DOTS)
UN Conference on Trade and Development (UNCTAD)
CIA The World Factbook
World Bank’s World Integrated Trade Solution
Forbes Global 2000