Includes historical data for Algeria’s Gross Domestic Product growth, debt-to-GDP ratio and more, as well as information on trade, banking and financial sector leadership.
Economy Diversifying Away From Oil
Hydrocarbon production plays a vital role in Algeria’s economy, with the oil and gas sector accounting for about a quarter of GDP, over 90% of product exports, and roughly 40% of government income. Over time, high global oil prices have helped Algeria preserve macroeconomic stability, amass significant foreign currency reserves, and minimize external debt. They have also allowed for important advances in economic and human development, with investments in infrastructure projects, social policies that alleviated poverty, and improvements in education, health and overall living standards.
Still, Algeria aims to diversify its economy, lessening its dependence on hydrocarbons and boosting job opportunities. With potential in agriculture, renewable energy and tourism, Algeria’s proximity to the European market represents an additional asset.
However, economic diversification faces obstacles, including restrictions on foreign investors, underdeveloped capital markets, and a financial sector dominated by public banks. State-driven growth, bureaucratic red tape, corruption, and poor infrastructure further inhibit the development of alternative private-sector industries.
Macroeconomy & Sovereign Data
| Type of Government | Parliamentary republic |
|---|---|
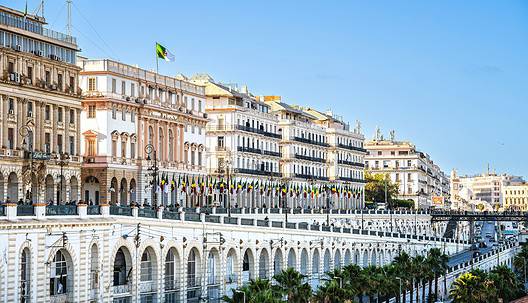
| Capital | Algiers |
| Sovereign Ratings |
S&P: Not rated Moody’s: Not rated Fitch: Not rated |
| Total Population | 46.6 million |
| Median Age | 28.5 |
| Adult Per Capita Income (PPP) | 19,776.93 |
| Total GDP (2023) | 266.8 billion |
Algeria GDP & Economic Overview
Most Recent Content
Algeria
Emerging & Frontier Markets
Algeria: Ambitious Goals, Investor Skepticism
Economics, Policy & Regulation
Sustained Growth In MENA Despite Turmoil
Economics, Policy & Regulation
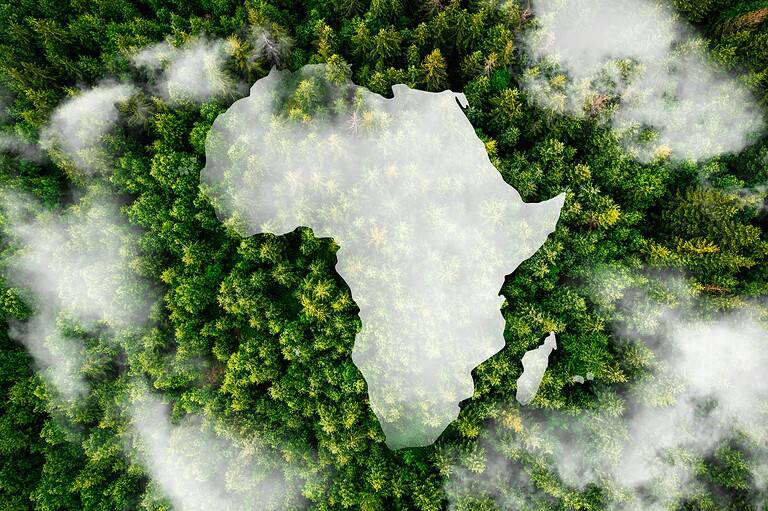
Central Banker Report Cards 2024: Africa And The Middle East
Capital Raising & Corporate Finance
Citadel’s Acquisition Boosts Power MarketBanking & Finance
Trade & Investment
| Total Exports | USD 46.7 billion (2023) |
|---|---|
| Leading Exports |
Natural Gas Crude Petroleum Refined Petroleum Fertilizers Ammonia |
| Total Imports | USD 66.5 billion (2022) |
| Leading Imports |
Refined Petroleum Wheat Packaged Medical Supplies Milk Vehicle Parts |
| Source: | World Integrated Trade Solution |
Algeria Leading Companies
| Sonatrach | Oil & Gas Exploration & Production |
|---|---|
| Naftal | Oil & Gas Distribution & Marketing |
| Banque Extérieure d'Algérie | Financials |
| Cosider | Construction & Engineering |
| Sider El Hadjar | Materials, Metals & Mining |
| Cevital | Conglomerate, Food Products, Real Estate, Industrials |
| Djezzy | Telecommunication Services |
Major Trade Partners — Import
| Italy | 16% |
|---|---|
| France | 13% |
| Spain | 12% |
| United States | 10% |
| Brazil | 6% |
Source: World Integrated Trade Solution
Major Trade Partners — Export
| China | 18% |
|---|---|
| France | 9% |
| Italy | 8% |
| Germany | 7% |
| Spain | 7% |
Source: World Integrated Trade Solution
Global Finance Rankings & Awards

Data Sources:
UN World Population Prospects
World Inequality Report
S&P Global Ratings
Moody’s
Fitch Ratings
IMF Direction of Trade Statistics (DOTS)
UN Conference on Trade and Development (UNCTAD)
CIA The World Factbook
World Bank’s World Integrated Trade Solution
Forbes Global 2000