
Includes historical data for Antigua and Barbuda’s Gross Domestic Product growth, debt-to-GDP ratio and more, as well as information on trade, banking and financial sector leadership.
Tourism And Financial Services Power Economy
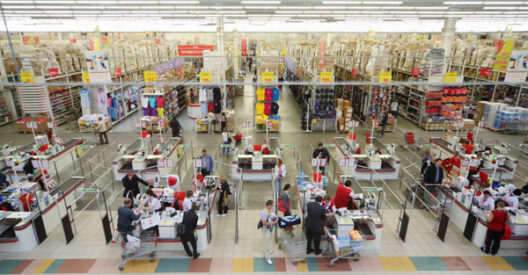
The economy of this island nation in the Caribbean thrives on a robust tourism industry, strong financial services and exports of agricultural products. With just 100,000 inhabitants and a relatively high GDP per capita, over 50% of all non-tax revenue also stems from its Citizenship by Investment program via contributions to the National Development Fund or the purchase of real estate. To diversify the economic landscape, the government actively welcomes foreign direct investment (FDI), allowing for full control of investment and ownership. Yet, despite the potential in information technology, renewable energy and agro-processing businesses, FDI inflows have remained moderate.
Weaknesses include the over-reliance on tourism, and food and energy imports. Additional concerns are posed by the threat of extreme weather events such as hurricanes. Further, as a major offshore hub and promoter of citizenship through investment schemes, the country serves as a potential intersection of financial crimes and other wrongdoings.
Macroeconomy & Sovereign Data
| Type of Government | Parliamentary democracy under a constitutional monarchy; a Commonwealth realm |
|---|---|
| Capital | St. Johns |
| Sovereign Ratings |
S&P: Not rated Moody’s: Not rated Fitch: Not rated |
| Total Population | 104,000 |
| Median Age | 35.9 |
| Adult Per Capita Income (PPP) | 26,753.30 |
| Total GDP (2023) | 2.1 billion |
Antigua and Barbuda GDP & Economic Overview
Most Recent Content
Antigua and Barbuda

Capital Raising & Corporate Finance
Global: Russia Moves Into High-Income
Banking & Finance
Trade & Investment
| Total Exports | USD 1.7 billion (2022) |
|---|---|
| Leading Exports |
Refined Petroleum Ships Gas Turbines Aircraft Parts Lobster Durum Wheat |
| Total Imports | USD 2.5 billion (2023) |
| Leading Imports |
Refined Petroleum Ships Recreational Boats Cars Poultry |
| Source: | World Integrated Trade Solution |
Antigua and Barbuda Leading Companies
| Antigua Commercial Bank (ACB) | Financials |
|---|---|
| Antigua Distillery | Consumer Staples, Distillers |
| The Antigua Public Utilities Authority | Utilities |
Major Trade Partners — Import
| United States | 48% |
|---|---|
| China | 7% |
| Japan | 4% |
| Trinidad and Tobago | 4% |
| Curação | 3% |
Major Trade Partners — Export
| United Arab Emirates | 53% |
|---|---|
| United States | 10% |
| Netherlands | 8% |
| Saint Maarten (Dutch part) | 6% |
| St. Lucia | 3% |
Global Finance Rankings & Awards

Data Sources:
UN World Population Prospects
World Inequality Report
S&P Global Ratings
Moody’s
Fitch Ratings
IMF Direction of Trade Statistics (DOTS)
UN Conference on Trade and Development (UNCTAD)
CIA The World Factbook
World Bank’s World Integrated Trade Solution
Forbes Global 2000