Includes historical data for Barbados’ Gross Domestic Product growth, debt-to-GDP ratio and more, as well as information on trade, banking and financial sector leadership.
Economy Transitions From Sugar To Financial Services
Historically reliant on sugarcane cultivation, over the past few decades this island of about 300,000 has invested in tourism, manufacturing and offshore financial services. As a member of CARICOM (Caribbean Community). Barbados is a middle-income country and the wealthiest in the Eastern Caribbean. Its strong institutions, the peg of its currency to theU.S. dollar, and its growing reputation as an international business hub have made this island an attractive destination for foreign direct investment (FDI).
However, challenges remain. Despite prioritizing investment initiatives in renewable energy, life sciences and technology, Barbados continues to rely heavily on tourism and to depend on imports for food and energy. High unemployment and income inequality, as well as vulnerability to climate change and natural disasters, remain concerns.
Macroeconomy & Sovereign Data
| Type of Government | Parliamentary democracy under a constitutional monarchy; a Commonwealth realm |
|---|---|
| Capital | Bridgetown |
| Sovereign Ratings |
S&P: BB– Moody’s: Ba3 Fitch: B+ |
| Total Population | 291,000 |
| Median Age | 39.9 |
| Adult Per Capita Income (PPP) | 19,642.26 |
| Total GDP (2023) | 6.9 billion |
Barbados GDP & Economic Overview
Most Recent Content
Barbados
Capital Raising & Corporate Finance
ANNUAL SURVEY: WORLD’S BEST BANKS 2014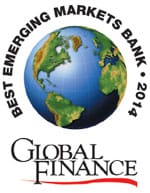

Banking & Finance
Trade & Investment
| Total Exports | USD 1.7 billion (2023) |
|---|---|
| Leading Exports |
Rums And Liquors Ships Packaged Medicines Cement Paper Labels |
| Total Imports | USD 344 million (2022) |
| Leading Imports |
Refined Petroleum Crude Petroleum Shipping Containers Cars Ships Packaged Medicines |
| Source: | World Integrated Trade Solution |
Barbados Leading Companies
| Sagicor Financial Corporation | Financials, Insurance |
|---|---|
| Mount Gay Rum Distilleries Ltd. | Consumer Staples, Distillers |
| Banks Holdings Limited (BHL) | Beer & Breweries |
| Barbados Tourism Investment (BTI) | Hotels, Restaurants & Leisure |
| Cable & Wireless Barbados | Telecommunication Services |
| National Petroleum Corporation (NPC) | Energy |
Major Trade Partners — Import
| United States | 36% |
|---|---|
| China | 16% |
| Mexico | 13% |
| Guatemala | 12% |
| Trinidad and Tobago | 2% |
Major Trade Partners — Export
| Unspecified | 21% |
|---|---|
| United States | 19% |
| Jamaica | 8% |
| Guyana | 8% |
| Trinidad and Tobago | 7% |
Global Finance Rankings & Awards


Data Sources:
UN World Population Prospects
World Inequality Report
S&P Global Ratings
Moody’s
Fitch Ratings
IMF Direction of Trade Statistics (DOTS)
UN Conference on Trade and Development (UNCTAD)
CIA The World Factbook
World Bank’s World Integrated Trade Solution
Forbes Global 2000