
Includes historical data for the Belarus’ Gross Domestic Product growth, debt-to-GDP ratio and more, as well as information on trade, banking and financial sector leadership.
Economy Hampered By State Interference And Corruption
After seven decades as part of the Soviet Union, Belarus reclaimed its sovereignty in 1991. Still, it remains characterized by an authoritarian regime and a centralized economic system, and maintains strong political and economic ties with Russia. Following Belarus’ support of Russia’s full-scale invasion of Ukraine in February 2022, the European Union imposed sanctions, many international firms and investors left the country, and trade declined sharply. Even before then, however, corruption, lack of judicial independence and bureaucratic hurdles were significant deterrents to attracting foreign capital.
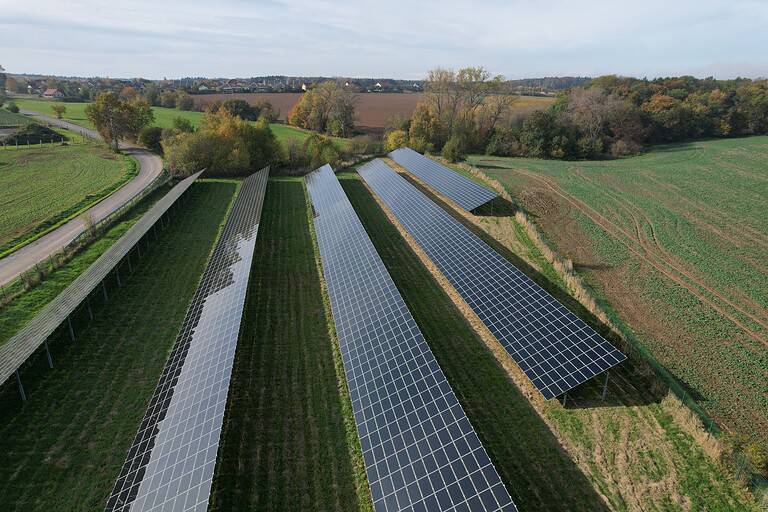
Despite a well-trained and skilled workforce, low inequality and poverty rates, and a large industrial and agricultural sector with potential in a wide range of industries, economic growth and business initiatives are hampered by state interference in the economy, outdated infrastructure and limited economic diversification and exports.
Macroeconomy & Sovereign Data
| Type of Government | Presidential republic |
|---|---|
| Capital | Minsk |
| Sovereign Ratings |
S&P: Selective default Moody’s: Ca Fitch: Rating watch |
| Total Population | 9.1 million |
| Median Age | 42.5 |
| Adult Per Capita Income (PPP) | 20,494.08 |
| Total GDP (2023) | 69.1 billion |
Belarus GDP & Economic Overview
Most Recent Content
Belarus
Economics, Policy & Regulation
Central Banker Report Cards 2024: EuropeCapital Raising & Corporate Finance
ANNUAL SURVEY: WORLD’S BEST BANKS 2014
Emerging & Frontier Markets
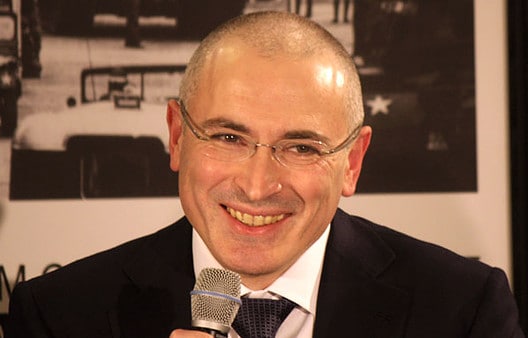
Free Bird: Yukos Oils Ex-Chief ReleasedBanking & Finance
Trade & Investment
| Total Exports | USD 32.6 billion (2023) |
|---|---|
| Leading Exports |
Fertilizers Refined Petroleum Cheese Delivery Trucks Lumber |
| Total Imports | USD 22.3 billion (2022) |
| Leading Imports |
Crude Petroleum Natural Gas Cars And Vehicle Parts Packaged Medicines Broadcasting Equipment |
| Source: | World Integrated Trade Solution |
Belarus Leading Companies
| Belarusbank | Financials |
|---|---|
| Belagroprombank | Financials |
| BelAZ | Automobiles & Components |
| Naftan Oil Refinery | Oil, Gas & Consumable Fuels |
| Belarusian Steel Works | Metals & Mining |
| Minsk Kristall | Consumer Staples, Distilled Spirits |
| Belaruskali | Materials, Chemicals |
Major Trade Partners — Import
| Unspecified | 37% |
|---|---|
| Russia | 29% |
| China | 8% |
| Germany | 4% |
| Ukraine | 3% |
Source: World Integrated Trade Solution
Major Trade Partners — Export
| Unspecified | 40% |
|---|---|
| Russia | 35% |
| Poland | 4% |
| Ukraine | 3% |
| Lithuania | 3% |
Source: World Integrated Trade Solution
Global Finance Rankings & Awards
Data Sources:
UN World Population Prospects
World Inequality Report
S&P Global Ratings
Moody’s
Fitch Ratings
IMF Direction of Trade Statistics (DOTS)
UN Conference on Trade and Development (UNCTAD)
CIA The World Factbook
World Bank’s World Integrated Trade Solution
Forbes Global 2000