Includes historical data for Belgium’s Gross Domestic Product growth, debt-to-GDP ratio and more, as well as information on trade, banking and financial sector leadership.
A Competitive Economy In The Heart of Europe
With its strategic location in the heart of Europe, Belgium is a competitive economy and trade hub. With first-rate infrastructure, including a dense network of roads and railways and Europe’s second-largest port (Antwerp-Bruges), its capital Brussels is also home to the EU and NATO headquarters, as well as numerous other international institutions and multinational corporations. Its highly educated workforce, world-class research, and highly diversified economy further enhance its appeal and attract substantial foreign direct investment.
However, challenges persist. Political and financial tensions divide the francophone Wallonia region to the south and the Dutch-speaking Flanders region in the north. A high tax burden and a costly welfare state strain the economy. Labor market rigidities hinder growth. Furthermore, Belgium’s economy relies heavily on Western European markets, making it particularly vulnerable to regional dynamics.
Macroeconomy & Sovereign Data
| Type of Government | Federal parliamentary democracy under a constitutional monarchy |
|---|---|
| Capital | Brussels |
| Sovereign Ratings |
S&P: AA Moody’s: Aa3 Fitch: AA– |
| Total Population | 11.8 million |
| Median Age | 43.4 |
| Adult Per Capita Income (PPP) | 69,043.12 |
| Total GDP (2023) | 540.9 billion |
Belgium GDP & Economic Overview
Most Recent Content
Belgium
Non-Economic Data
Most Technologically Advanced Countries In The World 2023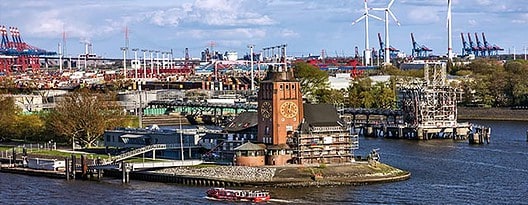

Economics, Policy & Regulation
YOUNG CONSERVATIVE TAKES HELM IN BELGIUM
Banking & Finance
Trade & Investment
| Total Exports | USD 531.2 billion (2023) |
|---|---|
| Leading Exports |
Vaccines And Cultures Cars Packaged Medicines Refined Petroleum Diamonds Natural Gas |
| Total Imports | USD 550.4 billion (2022) |
| Leading Imports |
Cars Refined Petroleum Packaged Medicines Medical Cultures/Vaccines Diamonds Natural Gas |
| Source: | World Integrated Trade Solution |
Belgium Leading Companies
| KBC Group | Financials, Banking, Insurance |
|---|---|
| Anheuser-Busch InBev | Consumer Staples, Beverages |
| Ageas | Insurance |
| Solvay | Chemicals |
| UCB | Pharmaceuticals |
| Proximus | Telecommunication Services |
| Colruyt | Consumer Discretionary, Broadline Retail |
Major Trade Partners — Import
| Netherlands | 21% |
|---|---|
| Germany | 16% |
| France | 10% |
| Ireland | 6% |
| United States | 5% |
Source: World Integrated Trade Solution
Major Trade Partners — Export
| Germany | 17% |
|---|---|
| France | 14% |
| Netherlands | 12% |
| United States | 7% |
| United Kingdom | 6% |
Source: World Integrated Trade Solution
Global Finance Rankings & Awards

Data Sources:
UN World Population Prospects
World Inequality Report
S&P Global Ratings
Moody’s
Fitch Ratings
IMF Direction of Trade Statistics (DOTS)
UN Conference on Trade and Development (UNCTAD)
CIA The World Factbook
World Bank’s World Integrated Trade Solution
Forbes Global 2000