Includes historical data for Bhutan’s Gross Domestic Product growth, debt-to-GDP ratio and more, as well as information on trade, banking and financial sector leadership.
Rising Prosperity But Challenges Remain
Since transitioning from an absolute monarchy to a democratic constitutional monarchy in 2008, Bhutan has embraced a development trajectory anchored in the principle of Gross National Happiness. This approach prioritizes cultural preservation and environmental sustainability, effective governance and inclusive socio-economic advancement.
As a lower-middle-income country, the landlocked Bhutan has witnessed on average an annual real GDP growth of 7.5% since the 1980s, leading to significant poverty reduction. Such growth has been principally driven by Bhutan’s abundant water resources, which have provided nearly universal access to low-cost electricity and revenue from surplus hydropower exports. Bhutan is now prioritizing private-sector development and economic diversification. The investment climate, however, remains challenging due to hurdles including a lack of a fully developed modern regulatory framework, high trade costs and a small domestic market.
Macroeconomy & Sovereign Data
| Type of Government | Democratic constitutional monarchy |
|---|---|
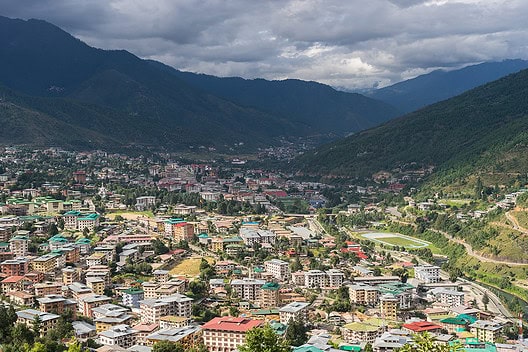
| Capital | Thimphu |
| Sovereign Ratings |
S&P: Not rated Moody’s: Not rated Fitch: Not rated |
| Total Population | 795,000 |
| Median Age | 30.47 |
| Adult Per Capita Income (PPP) | USD 21,356.38 |
| Total GDP (2025) | USD 3.41 billion |
Bhutan GDP & Economic Overview
Most Recent Content
Bhutan
Emerging & Frontier Markets
Bhutan: The Happiness Economy
Emerging & Frontier Markets
Bhutan: Tight Spot
Emerging & Frontier Markets
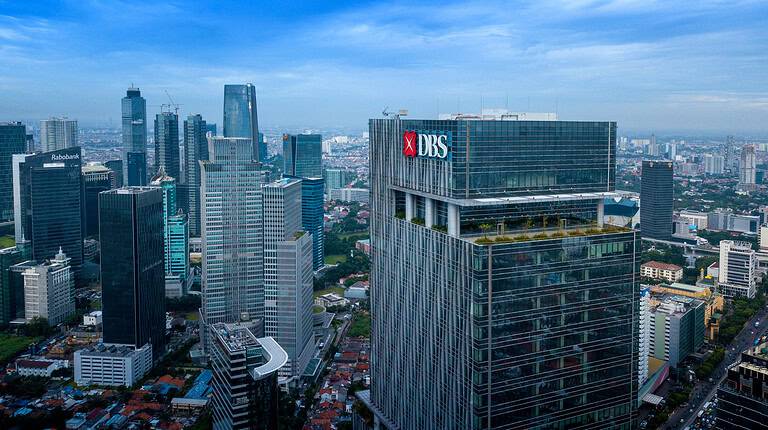
Features : A Mission To IndiaBanking & Finance
Trade & Investment
| Total Exports | USD 0.456 billion (2024) |
|---|---|
| Leading Exports |
Iron Alloys Dolomite Aircraft Cement Semi-Finished Iron |
| Total Imports | USD 1.634 billion (2024) |
| Leading Imports |
Refined Petroleum Gold Plastics Broadcasting Equipment Iron Reductions |
| Source: | IMF, CIA The World Factbook |
Bhutan Leading Companies
| Druk Air | Transportation, Airlines |
|---|---|
| Bhutan National Bank | Financials |
| Bhutan Power Corporation | Utilities |
| Kuensel Corporation | Media, Publishing |
| Druk Holding and Investments | Conglomerates, Financials, Energy, Consumer Services |
| Tashi Commercial Corporation | Conglomerates, Financials, Communication Services, Materials |
| Menjong Beer Brewery | Consumer Discretionary |
Major Trade Partners — Import
| India | 79.9% |
|---|---|
| China | 6.46% |
| Singapore | 5.17% |
| Thailand | 1.66% |
| Hong Kong SAR | 1.5% |
Major Trade Partners — Export
| India | 77.57% |
|---|---|
| Bangladesh | 13.98% |
| Italy | 4.24% |
| Nepal | 1.99% |
| China | 0.83% |
Global Finance Rankings & Awards


Data Sources:
UN World Population Prospects
World Inequality Report
S&P Global Ratings
Moody’s
Fitch Ratings
IMF Direction of Trade Statistics (DOTS)
UN Conference on Trade and Development (UNCTAD)
CIA The World Factbook
World Bank’s World Integrated Trade Solution
Forbes Global 2000