Includes historical data for Bolivia’s Gross Domestic Product growth, debt-to-GDP ratio and more, as well as information on trade, banking and financial sector leadership.
Economy Driven By Tourism, Hospitality, And Real Estate
Bolivia is home to abundant mineral and agricultural resources, including natural gas, gold, zinc, silver and lithium reserves, as well as crops like soy and quinoa. As a member of the free trade bloc Andean Community and soon-to-be a full member of the Southern Common Market (Mercosur), Bolivia’s currency peg to theU.S. dollar fosters monetary stability. Furthermore, the country holds significant potential in tourism, manufacturing and renewable energy.
Despite these strengths, Bolivia faces significant challenges. The economy remains insufficiently diversified and vulnerable to commodity price fluctuations. High public debt, and structural and institutional challenges, including a vulnerable judicial system and weak rule of law, impede economic freedom and deter foreign direct investment (FDI). The state’s expanding role in economic activity, outdated labor laws and child labor issues pose additional concerns.
Macroeconomy & Sovereign Data
| Type of Government | Presidential republic |
|---|---|
| Capital | La Paz (administrative capital); Sucre (constitutional [legislative and judicial] capital) |
| Sovereign Ratings |
S&P: B– Moody’s: Caa2 Fitch: Not rated |
| Total Population | 12.3 million |
| Median Age | 24.7 |
| Adult Per Capita Income (PPP) | 15,146.02 |
| Total GDP (2023) | 49.3 billion |
Bolivia GDP & Economic Overview
Most Recent Content
Bolivia
Economics, Policy & Regulation
Bolivia Plans New Electricity Law Amid National Crisis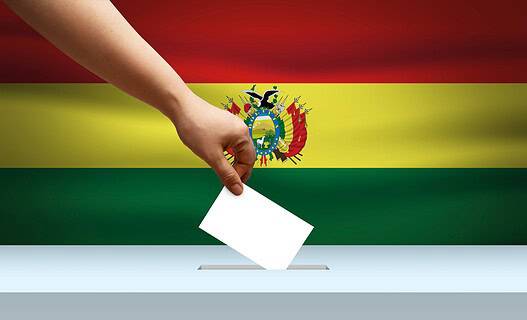
Emerging & Frontier Markets
Bolivia: Underdog Becomes New President
Economics, Policy & Regulation
Central Banker Report Cards 2024: The Americas
Banking & Finance
Trade & Investment
| Total Exports | USD 7.8 billion (2023) |
|---|---|
| Leading Exports |
Gold Natural Gas Zinc Silver Soy Products Tin |
| Total Imports | USD 14.1 billion (2022) |
| Leading Imports |
Cars Refined Petroleum Delivery Trucks Iron Buses |
| Source: | World Integrated Trade Solution |
Bolivia Leading Companies
| Banco Nacional de Bolivia | Financials |
|---|---|
| Banco Bisa | Financials |
| Banco Mercantil Santa Cruz | Financials |
| YPFB (Yacimientos Petrolíferos Fiscales Bolivianos) | Energy, Oil & Gas Exploration & Production |
| Empresa Nacional de Electricidad (ENDE) | Utilities |
| Empresa Metalúrgica Vinto (EMV) | Metals & Mining |
| PIL Andina | Consumer Staples, Dairy Products |
Major Trade Partners — Import
| China | 21% |
|---|---|
| Brazil | 18% |
| Argentina | 13% |
| Peru | 8% |
| Chile | 7% |
Major Trade Partners — Export
| India | 17% |
|---|---|
| Brazil | 13% |
| Argentina | 9% |
| Japan | 8% |
| Colombia | 6% |
Data Sources:
UN World Population Prospects
World Inequality Report
S&P Global Ratings
Moody’s
Fitch Ratings
IMF Direction of Trade Statistics (DOTS)
UN Conference on Trade and Development (UNCTAD)
CIA The World Factbook
World Bank’s World Integrated Trade Solution
Forbes Global 2000