
Includes historical data for Brunei Darussalam’s Gross Domestic Product growth, debt-to-GDP ratio and more, as well as information on trade, banking and financial sector leadership.
Growth Reliant On Energy Exports
A Southeast Asian nation with a population of less than half a million, Brunei relies heavily on its oil and gas sector, which accounts for about 75% of government revenue and roughly half of GDP, making it one of the world’s wealthiest countries. The government strives to expand beyond its oil-dependent economy and actively promotes foreign direct investment through streamlined processes, and tax reliefs and incentives. Key investment sectors include aerospace, defense, agribusiness, and projects in solar power, electric vehicles and emissions reduction.
Weaknesses include exposure to fluctuating international oil prices, supply chain disruptions and reliance on imports for manufactured goods. Further, the government’s strong presence in the economy hampers competition and stifles private-sector initiatives.
Macroeconomy & Sovereign Data
| Type of Government | Absolute monarchy or sultanate (locally known as Malay Islamic Monarchy) |
|---|---|
| Capital | Bandar Seri Begawan |
| Sovereign Ratings |
S&P: Not rated Moody’s: Not rated Fitch: Not rated |
| Total Population | 460,000 |
| Median Age | 32.7 |
| Adult Per Capita Income (PPP) | USD 107,803 |
| Total GDP (2025) | USD 15.7 billion |
Brunei Darussalam GDP & Economic Overview
Most Recent Content
Brunei

Economics, Policy & Regulation
The Tiger Uncrouches
Emerging & Frontier Markets
Brunei Darussalam: Ditching Dependence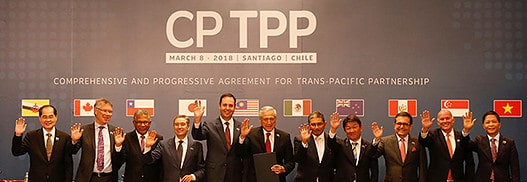
Economics, Policy & Regulation
New CPTPP Chips Away At U.S. Prestige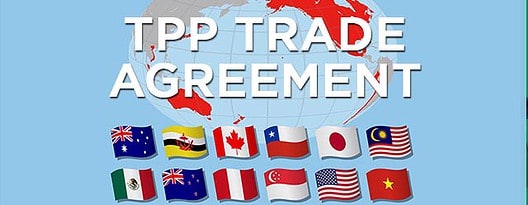
Capital Raising & Corporate Finance
Corporates Rush To Decipher Landmark Trade AgreementBanking & Finance
Trade & Investment
| Total Exports | USD 11.26 billion (2024) |
|---|---|
| Leading Exports |
Refined Petroleum Natural Gas Crude Petroleum Hydrocarbons Fertilizers |
| Total Imports | USD 7.12 billion (2024) |
| Leading Imports |
Crude Petroleum Refined Petroleum Cars Coal Gold |
| Source: | IMF, CIA The World Factbook |
Brunei Darussalam Leading Companies
| Bank Islam Brunei Darussalam | Financials |
|---|---|
| Baiduri Bank | Financials |
| Brunei Shell Petroleum (BSP) | Energy, Exploration & Production |
| DST Group | Telecommunication Services |
| Royal Brunei Airlines | Transportation, Airlines |
| Pertamina Brunei | Energy, Exploration & Production |
| Brunei Fertilizer Industry (BFI) | Materials, Chemicals |
Major Trade Partners — Import
| Malaysia | 26.4% |
|---|---|
| United Arab Emirates | 10.9% |
| China | 10.5% |
| Australia | 7.24% |
| Qatar | 6.28% |
Major Trade Partners — Export
| Australia | 21.61% |
|---|---|
| Singapore | 17.07% |
| China | 16.69% |
| Japan | 13.9% |
| Malaysia | 6.83% |
Global Finance Rankings & Awards


Data Sources:
UN World Population Prospects
World Inequality Report
S&P Global Ratings
Moody’s
Fitch Ratings
IMF Direction of Trade Statistics (DOTS)
UN Conference on Trade and Development (UNCTAD)
CIA The World Factbook
World Bank’s World Integrated Trade Solution
Forbes Global 2000