Includes historical data for Bulgaria’s Gross Domestic Product growth, debt-to-GDP ratio and more, as well as information on trade, banking and financial sector leadership.
A Diversified Economy With Strong Agriculture And Manufacturing
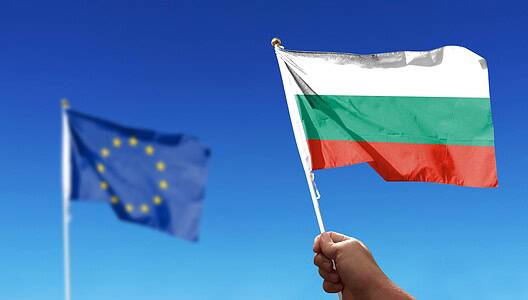
Once a communist state, Bulgaria has gradually transformed into a market-oriented, fast-growing economy, joining the EU in 2007. With a population of around 6.5 million, Bulgaria boasts a diversified agricultural, manufacturing and industrial base, as well as remarkable growth in the information technology, technical support and business process outsourcing industries. Furthermore, with the Bulgarian lev pegged to the euro and the absence of legal constraints on foreign ownership or control of firms, numerous U.S. and European companies have established global and regional service centers in the country.
However, Bulgaria still grapples with significant challenges, including entrenched corruption and bureaucratic inefficiencies, inadequate infrastructure, and having the EU’s lowest per-capita income. Labor shortages, a substantial informal economy and low labor productivity rates are additional concerns. A heavy dependence on energy imports poses further hurdles.
Macroeconomy & Sovereign Data
| Type of Government | Parliamentary republic |
|---|---|
| Capital | Sofia |
| Sovereign Ratings |
S&P: BBB Moody’s: Baa1 Fitch: BBB |
| Total Population | 6.4 million |
| Median Age | 41.1 |
| Adult Per Capita Income (PPP) | 30,333.84 |
| Total GDP (2023) | 107.9 billion |
Bulgaria GDP & Economic Overview
Most Recent Content
Bulgaria
Economics, Policy & Regulation
Bulgaria’s Looming Election Overshadows EU Membership
Executive Interviews
Dimitar Radev: Preparing For Euro Membership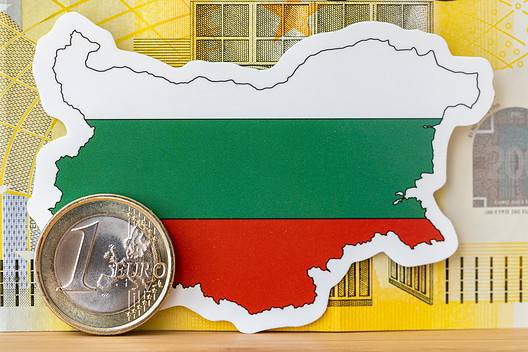
Economics, Policy & Regulation
Bulgaria: Eurozone Ambitions Test Public Trust
Emerging & Frontier Markets
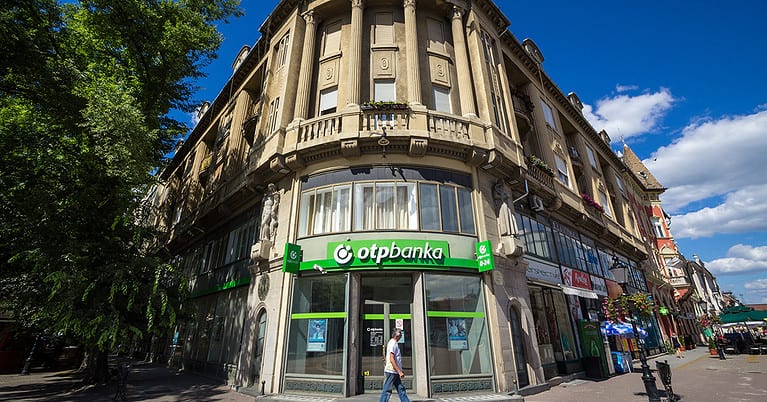
Bulgaria: Return To GrowthBanking & Finance
Trade & Investment
| Total Exports | USD 53.1 billion (2023) |
|---|---|
| Leading Exports |
Copper Wheat Electricity Refined Petroleum Packaged Medicines |
| Total Imports | USD 54.9 billion (2022) |
| Leading Imports |
Crude Petroleum Copper Cars Packaged Medicines Refined Petroleum |
| Source: | World Integrated Trade Solution |
Bulgaria Leading Companies
| United Bulgarian Bank | Financials |
|---|---|
| First Investment Bank | Financials |
| Texim Bank | Financials |
| Chimimport | Materials, Chemicals |
| Vivacom | Telecommunications Services |
| Bulgarian Energy Holding | Electric Utilities, Coal & Consumable Fuels |
| Fantastico | Consumer Staples, Food Retail |
Major Trade Partners — Import
| Germany | 12% |
|---|---|
| Türkiye | 8% |
| Russia | 8% |
| Romania | 8% |
| Italy | 7% |
Source: World Integrated Trade Solution
Major Trade Partners — Export
| Germany | 15% |
|---|---|
| Romania | 10% |
| Italy | 8% |
| Greece | 7% |
| Türkiye | 6% |
Source: World Integrated Trade Solution
Global Finance Rankings & Awards

Data Sources:
UN World Population Prospects
World Inequality Report
S&P Global Ratings
Moody’s
Fitch Ratings
IMF Direction of Trade Statistics (DOTS)
UN Conference on Trade and Development (UNCTAD)
CIA The World Factbook
World Bank’s World Integrated Trade Solution
Forbes Global 2000