Includes historical data for Burkina Faso’s Gross Domestic Product growth, debt-to-GDP ratio and more, as well as information on trade, banking and financial sector leadership.
A Poor Country Rich In Resources
Despite being a major producer of cotton and gold, this landlocked country remains among the world’s poorest. With about 80% of the population engaged in subsistence farming, its economy is inextricably dependent on adequate rainfall. To pursue its economic development and diversification, Burkina Faso encourages foreign investment with tax rates below the regional average and additional incentives. While the bulk of foreign capital continues to flow into the mining industry, investors are also active in the agriculture, banking, transport and logistics, energy and telecommunications sectors. A member of the West African Economic and Monetary Union, the country also enjoys support from the international financial community.
Yet, burdensome regulations and opaque practices still hinder the growth of a more vibrant private sector. Other challenges include unreliable energy supplies, poor transportation infrastructure and a large informal sector. Particularly concerning is the deteriorating political stability and security environment, with coup attempts reportedly triggered by the government’s inability to counter armed Islamist groups controlling large swaths of the country.
Macroeconomy & Sovereign Data
| Type of Government | Presidential republic |
|---|---|
| Capital | Ouagadougou |
| Sovereign Ratings |
S&P: CCC+ Moody’s: Not rated Fitch: Not rated |
| Total Population | 24.1 million |
| Median Age | 17.0 |
| Adult Per Capita Income (PPP) | 5,049.14 |
| Total GDP (2023) | 21.9 billion |
Burkina Faso GDP & Economic Overview
Most Recent Content
Burkina Faso
Economics, Policy & Regulation
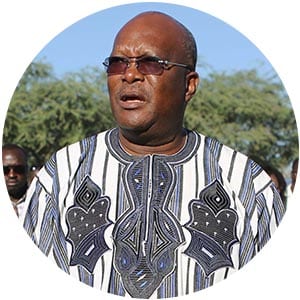
Burkina Faso’s New President Has An EdgeCapital Raising & Corporate Finance
ANNUAL SURVEY: WORLD’S BEST BANKS 2014Awards
BEST BANKS 2014: AFRICABanking & Finance
Trade & Investment
| Total Exports | USD 4.1 billion (2023) |
|---|---|
| Leading Exports |
Gold Cotton Zinc Cashews Sesame Seeds |
| Total Imports | USD 4.9 billion (2022) |
| Leading Imports |
Refined Petroleum Delivery Trucks Packaged Medicines Electricity Aircraft |
| Source: | World Integrated Trade Solution |
Burkina Faso Leading Companies
| Bank of Africa Burkina Faso | Financials |
|---|---|
| Banque Internationale pour le Commerce, l'Industrie et l'Agriculture | Financials |
| Essakane Gold Mine | Materials, Metals & Mining |
| Société des Mines de Belahouro | Materials, Metals & Mining |
| Société Burkinabè des Fibres Textiles | Consumer Durables, Textiles |
| Onatel | Telecommunication Services |
| Société Nationale d'Électricité du Burkina Faso | Utilities |
Major Trade Partners — Import
| China | 14% |
|---|---|
| Côte d'Ivoire | 8% |
| France | 8% |
| United States | 7% |
| Ghana | 6% |
Source: World Integrated Trade Solution
Major Trade Partners — Export
| Switzerland | 73% |
|---|---|
| India | 10% |
| Singapore | 4% |
| Côte d'Ivoire | 9% |
| Mali | 2% |
Source: World Integrated Trade Solution
Global Finance Rankings & Awards


Data Sources:
UN World Population Prospects
World Inequality Report
S&P Global Ratings
Moody’s
Fitch Ratings
IMF Direction of Trade Statistics (DOTS)
UN Conference on Trade and Development (UNCTAD)
CIA The World Factbook
World Bank’s World Integrated Trade Solution
Forbes Global 2000