Includes historical data for Burundi’s Gross Domestic Product growth, debt-to-GDP ratio and more, as well as information on trade, banking and financial sector leadership.
Weak Economy Worsened By Political Instability
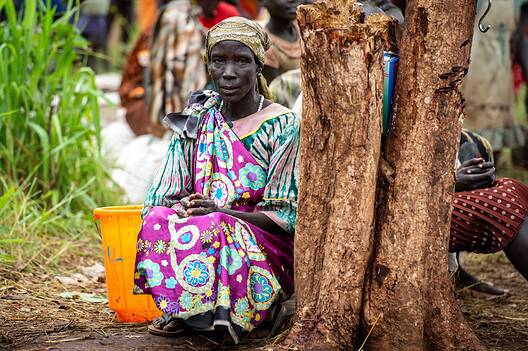
Situated in Central Africa, this landlocked country of approximately 13 million people is one of the world’s poorest nations. A member of the East African Community (EAC), in recent years Burundi has taken steps to improve its political and economic governance, and to provide employment to its young and rapidly growing population beyond the dominant mining and agricultural sectors. The government has particularly focused its efforts on infrastructure development, including power plants, road projects, and port, airport and railway upgrades. However, foreign direct investment (FDI) faces significant deterrents, including an inefficient regulatory environment, bureaucratic barriers and an underdeveloped financial system. Corruption, a low-skilled workforce, and unreliable electricity supply are additional issues.
Today, Burundi continues to rely heavily on aid from bilateral and multilateral donors. Ethnic disputes, attempted coups d’état, and military encroachment on democratic institutions further complicate the situation.
Macroeconomy & Sovereign Data
| Type of Government | Presidential republic |
|---|---|
| Capital | Gitega |
| Sovereign Ratings |
S&P: Not rated Moody’s: Not rated Fitch: Not rated |
| Total Population | 13.7 million |
| Median Age | 16.2 |
| Adult Per Capita Income (PPP) | 1,667.37 |
| Total GDP (2023) | 3.1 billion |
Burundi GDP & Economic Overview
Most Recent Content
Burundi
Economic Data
Poorest Countries in the World 2025
Emerging & Frontier Markets
An EU In Africa?
Award Winners
Best Trade Finance Banks 2011Banking & Finance
Trade & Investment
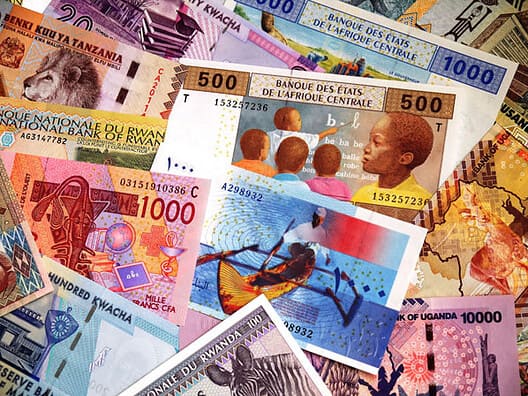
| Total Exports | USD 871.8 million (2023) |
|---|---|
| Leading Exports |
Gold Coffee Tea Raw Earth Metal Ores Beer |
| Total Imports | USD 127.2 million (2022) |
| Leading Imports |
Refined Petroleum Packaged Medicines Cement Raw Sugar Cars |
| Source: | World Integrated Trade Solution |
Burundi Leading Companies
| Banque de Gestion et de Financement | Financials |
|---|---|
| Interbank | Financials |
| Brarudi | Consumer Staples, Beverages |
| Burundi National Radio and Television | Media, Broadcasting |
| Régie de Distribution d’Eau et d’Electricité | Utilities |
| Econet Wireless Burundi | Telecommunication Services |
| Socabu | Financials, Insurance |
Major Trade Partners — Import
| China | 18% |
|---|---|
| Saudi Arabia | 12% |
| Tanzania | 10% |
| India | 9% |
| United Arab Emirates | 7% |
Source: World Integrated Trade Solution
Major Trade Partners — Export
| United Arab Emirates | 28% |
|---|---|
| Democratic Republic of the Congo | 21% |
| Belgium | 8% |
| Pakistan | 6% |
| Tanzania | 5% |
Source: World Integrated Trade Solution
Global Finance Rankings & Awards


Data Sources:
UN World Population Prospects
World Inequality Report
S&P Global Ratings
Moody’s
Fitch Ratings
IMF Direction of Trade Statistics (DOTS)
UN Conference on Trade and Development (UNCTAD)
CIA The World Factbook
World Bank’s World Integrated Trade Solution
Forbes Global 2000