
Includes historical data for Chad’s Gross Domestic Product growth, debt-to-GDP ratio and more, as well as information on trade, banking and financial sector leadership.
Strong Economic Potential
Since gaining independence from France in 1960, this landlocked nation in central Africa has been marred by political instability and violence. Still, with rich gold, uranium and oil resources, a large agricultural capacity, and a young and rapidly growing population of over 18 million people, Chad holds remarkable economic potential.
Despite these strengths, Chad’s progress toward full economic development remains hindered by a multitude of factors, including inadequate infrastructure, a lack of reliable transportation networks, and unreliable electricity supply. An inefficient regulatory system, widespread corruption, a lack of skilled labor, and high poverty rates further stymie the emergence of a thriving private sector.
Macroeconomy & Sovereign Data
| Type of Government | Presidential republic |
|---|---|
| Capital | N’Djamena |
| Sovereign Ratings |
S&P: Not rated Moody’s: Not rated Fitch: Not rated |
| Total Population | 18.4 |
| Median Age | 15.2 |
| Adult Per Capita Income (PPP) | 3,856.65 |
| Total GDP (2023) | 18.7 billion |
Chad GDP & Economic Overview
Most Recent Content
Chad

Capital Raising & Corporate Finance
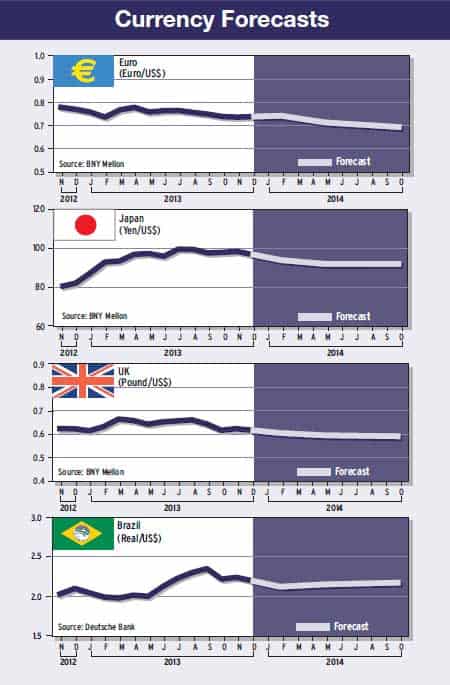
FX: Deflation Woes Deflate the Euro
Emerging & Frontier Markets
Africa: Chad’s Pipeline Dreams
Banking & Finance
Trade & Investment
| Total Exports | USD 1.2 billion (2023) |
|---|---|
| Leading Exports |
Crude Petroleum Gold Sesame Seeds Gum Arabic Silver |
| Total Imports | USD 4.9 billion (2022) |
| Leading Imports |
Delivery Trucks Paints Packaged Medicines Aircraft Broadcasting Equipment |
| Source: | World Integrated Trade Solution |
Chad Leading Companies
| Société Tchadienne de Banque | Financials |
|---|---|
| Banque de l'Habitat du Tchad | Financials |
| Société Tchadienne des Hydrocarbures | Integrated Oil & Gas |
| Société Nationale d'Electricité du Tchad | Utilities |
| Société Nationale de Distribution du Tchad | Consumer Staples Distribution & Retail |
| Agence Nationale des Grands Travaux | Construction & Engineering Services |
| Société Nationale de l'Immobilier du Tchad | Real Estate |
Global Finance Rankings & Awards


Data Sources:
UN World Population Prospects
World Inequality Report
S&P Global Ratings
Moody’s
Fitch Ratings
IMF Direction of Trade Statistics (DOTS)
UN Conference on Trade and Development (UNCTAD)
CIA The World Factbook
World Bank’s World Integrated Trade Solution
Forbes Global 2000