
Includes historical data for Chile’s Gross Domestic Product growth, debt-to-GDP ratio and more, as well as information on trade, banking and financial sector leadership.
A Commodities Export-Driven Economy
One of South America’s most prosperous nations, Chile is the world’s leading producer of copper and the second-largest producer of lithium. In addition to mining, Chile’s economy is bolstered by rich agricultural, fishery and forestry resources.
Chile’s flexible monetary, fiscal and exchange rate policies have facilitated numerous free-trade agreements. As a member of the OECD and the Pacific Alliance, Chile’s transparent business environment and strong institutional framework make it an attractive choice for foreign investors. Weaknesses include regulatory barriers, shortage of highly skilled workers and relatively low export diversification.
Macroeconomy & Sovereign Data
| Type of Government | Presidential Republic |
|---|---|
| Capital | Santiago |
| Sovereign Ratings |
S&P: BB Moody’s: Ba2 Fitch: BB |
| Total Population | 20.1 million |
| Median Age | 36.3 |
| Adult Per Capita Income (PPP) | 35,432.13 |
| Total GDP (2023) | 333.8 billion |
Chile GDP & Economic Overview
Most Recent Content
Chile

Economics, Policy & Regulation
Chile’s New President Moves Country To Right
Capital Raising & Corporate Finance
Global Salon: Aclara Takes On China In Rare Earth Processing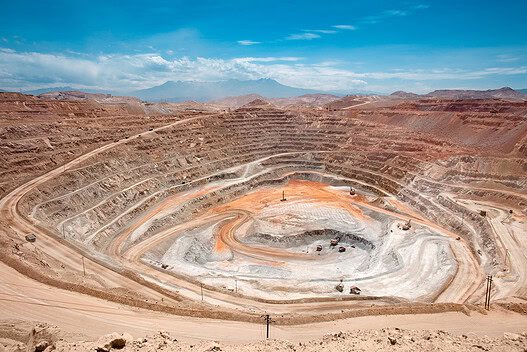
Economics, Policy & Regulation
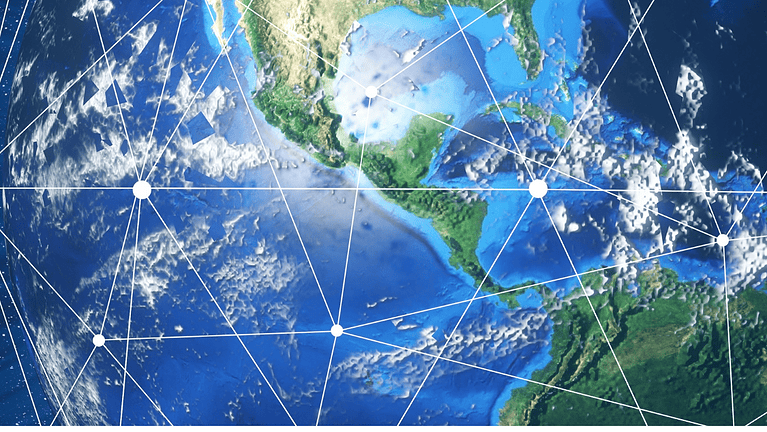
Latin America: The New Battleground For Critical Minerals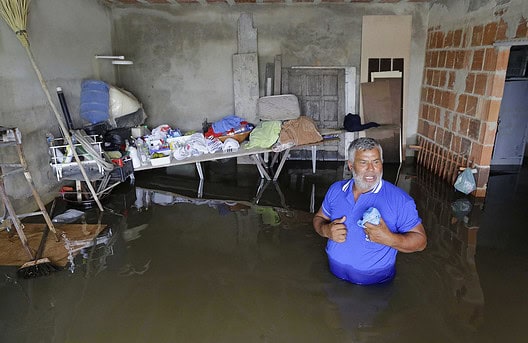
Sustainable Finance
Latin America: Disaster And OpportunityBanking & Finance
Trade & Investment
| Total Exports | USD 81.1 billion (2023) |
|---|---|
| Leading Exports |
Copper Fish Fillets Wood Pulp Pitted Fruits Wine |
| Total Imports | USD 112.6 billion (2022) |
| Leading Imports |
Refined Petroleum Crude Petroleum Cars Broadcasting Equipment Delivery Trucks |
| Source: | World Integrated Trade Solution |
Chile Leading Companies
| Quiñenco Group | Financials |
|---|---|
| AntarChile | Food & Staples Retailing |
| Sociedad Química y Minera de Chile (SQM) | Materials, Chemicals |
| Latam Airlines | Airlines |
| Falabella | Consumer Discretionary, General Merchandise Stores |
| Banco de Crédito e Inversiones (BCI) | Financials |
Major Trade Partners — Import
| China | 30% |
|---|---|
| United States | 17% |
| Brazil | 8% |
| Argentina | 5% |
| Germany | 3% |
Major Trade Partners — Export
| China | 39% |
|---|---|
| United States | 16% |
| Japan | 8% |
| South Korea | 5% |
| Brazil | 5% |
Global Finance Rankings & Awards
Data Sources:
UN World Population Prospects
World Inequality Report
S&P Global Ratings
Moody’s
Fitch Ratings
IMF Direction of Trade Statistics (DOTS)
UN Conference on Trade and Development (UNCTAD)
CIA The World Factbook
World Bank’s World Integrated Trade Solution
Forbes Global 2000