Includes historical data for Côte d’Ivoire’s Gross Domestic Product growth, debt-to-GDP ratio and more, as well as information on trade, banking and financial sector leadership.
Rapid Economic Growth And A Young Population
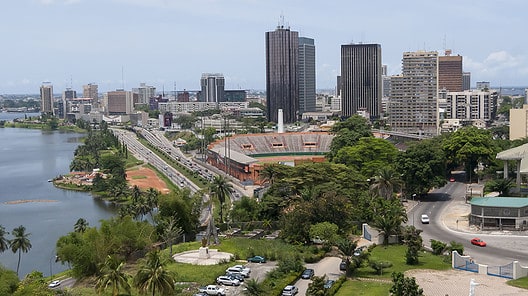
Considered the economic powerhouse of Francophone West Africa, this country of over 30 million people has consistently achieved some of the continent’s fastest growth rates, owing to its savvy macroeconomic policies and relatively stable institutions. In recent years, the government’s focus on economic transformation away from commodity exports has led to increased value-added processing contributions to GDP and job creation across various sectors, including renewable energy, digital economy, banking and manufacturing. The country’s strengths also include a diverse array of resources, ranging from agricultural wealth (as the world’s largest producer of cocoa and cashew nuts, and a top producer of coffee, sugar and rubber) to mineral wealth (including hydrocarbons, gold, copper and iron). Moreover, with over 70% of its population under 35, Côte d’Ivoire benefits from a large, youthful and cost-effective workforce.
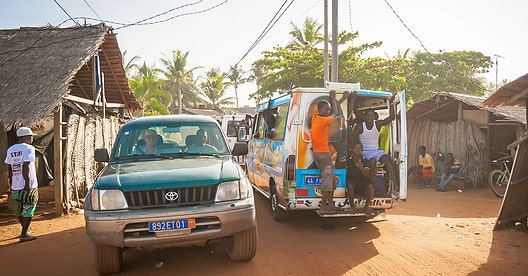
However, challenges persist. The country remains vulnerable to climatic hazards and fluctuations in commodity prices. Corruption, inadequate infrastructure, and uneven access to banking services further hinder entrepreneurial initiatives. A substantial informal economy and a significant wealth gap between urban and rural centers pose additional challenges.
Macroeconomy & Sovereign Data
| Type of Government | Presidential republic |
|---|---|
| Capital | Yamoussoukro |
| Sovereign Ratings |
S&P: BB– Moody’s: Ba2 Fitch: BB– |
| Total Population | 32.0 million |
| Median Age | 18.1 |
| Adult Per Capita Income (PPP) | 13,731.87 |
| Total GDP (2023) | 86.9 billion |
Côte d’Ivoire GDP & Economic Overview
Most Recent Content
Cote d'Ivoire
Emerging & Frontier Markets
Côte D’Ivoire Bounces Back
Emerging & Frontier Markets
Côte d’Ivoire: Poised For Peace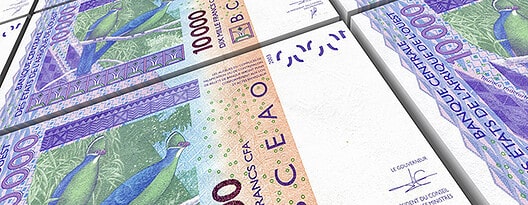
Banking & Finance
Trade & Investment
| Total Exports | USD 17.8 billion (2023) |
|---|---|
| Leading Exports |
Cocoa Products Rubber Gold Cashews Crude Petroleum Bananas |
| Total Imports | USD 16.5 billion (2022) |
| Leading Imports |
Crude Petroleum Rice Frozen Fish Refined Petroleum Packaged Medicines |
| Source: | World Integrated Trade Solution |
Côte d’Ivoire Leading Companies
| Société Ivoirienne de Raffinage | Oil & Gas Refining & Marketing |
|---|---|
| Sifca Group | Consumer Staples, Food Production |
| Société Ivoirienne de Fabrication de Café | Consumer Staples, Food Production |
| Compagnie de Téléphone de Côte d'Ivoire | Telecommunication Services |
| Société Africaine de Plantation d'Hévéas | Materials, Chemicals |
| Société des Mines d'Ity | Materials, Metals & Mining |
| Solibra | Consumer Staples, Beverages |
Major Trade Partners — Import
| China | 15% |
|---|---|
| Nigeria | 13% |
| France | 11% |
| India | 5% |
| United States | 4% |
Source: World Integrated Trade Solution
Major Trade Partners — Export
| Netherlands | 10% |
|---|---|
| United States | 7% |
| Switzerland | 6% |
| Vietnam | 6% |
| Belgium | 5% |
Source: World Integrated Trade Solution
Global Finance Rankings & Awards

Data Sources:
UN World Population Prospects
World Inequality Report
S&P Global Ratings
Moody’s
Fitch Ratings
IMF Direction of Trade Statistics (DOTS)
UN Conference on Trade and Development (UNCTAD)
CIA The World Factbook
World Bank’s World Integrated Trade Solution
Forbes Global 2000