Includes historical data for Denmark’s Gross Domestic Product growth, debt-to-GDP ratio and more, as well as information on trade, banking and financial sector leadership.
A Business-Friendly Environment
Denmark is a high-income society equipped with world-class infrastructure, a skilled labor force, and a robust social welfare system that ensures minimal income inequality and promotes social cohesion. Committed to liberal trade and investment policies, this country of approximately 6 million people also benefits from exceptional political, economic, and regulatory stability. Competitive corporate tax rates and other incentives attract significant foreign direct investment (FDI). A leader in the pharmaceuticals, maritime shipping, agriculture, and renewable energy sectors, Denmark also benefits from its strategic geographical position between Northern and Western Europe, and is a gateway between the Atlantic Ocean and the Baltic Sea. A member of the EU, Denmark is not part of the eurozone, although its currency is pegged to the euro.
Amidst these strengths, Denmark faces challenges, including its over-reliance on foreign trade, heavy tax burdens, and soaring household debt.
Macroeconomy & Sovereign Data
| Type of Government | Parliamentary constitutional monarchy |
|---|---|
| Capital | Copenhagen |
| Sovereign Ratings |
S&P: AAA Moody’s: Aaa Fitch: AAA |
| Total Population | 6.0 million |
| Median Age | 41.3 |
| Adult Per Capita Income (PPP) | 81,198.78 |
| Total GDP (2023) | 500.0 billion |
Denmark GDP & Economic Overview
Most Recent Content
Denmark
Economics, Policy & Regulation
Central Banker Report Cards 2024: Europe
Economics, Policy & Regulation
Inflation Warrior: Q&A With National Bank of Denmark Governor Christian…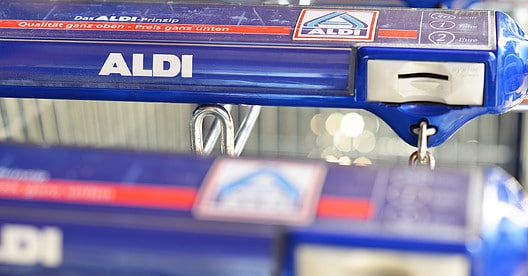
Capital Raising & Corporate Finance
Danish Regulator Eyes Norwegian Grocery Chain
Capital Raising & Corporate Finance
Royal Dutch Shell’s New CFO Must Organize A Russian GoodbyeBanking & Finance
Trade & Investment
| Total Exports | USD 125.3 billion (2023) |
|---|---|
| Leading Exports |
Packaged Medicines Pork Refined Petroleum Electric Generators Cheese |
| Total Imports | USD 127.3 billion (2022) |
| Leading Imports |
Cars Packaged Medicines Refined Petroleum Crude Petroleum Broadcasting Equipment Computers |
| Source: | World Integrated Trade Solution |
Denmark Leading Companies
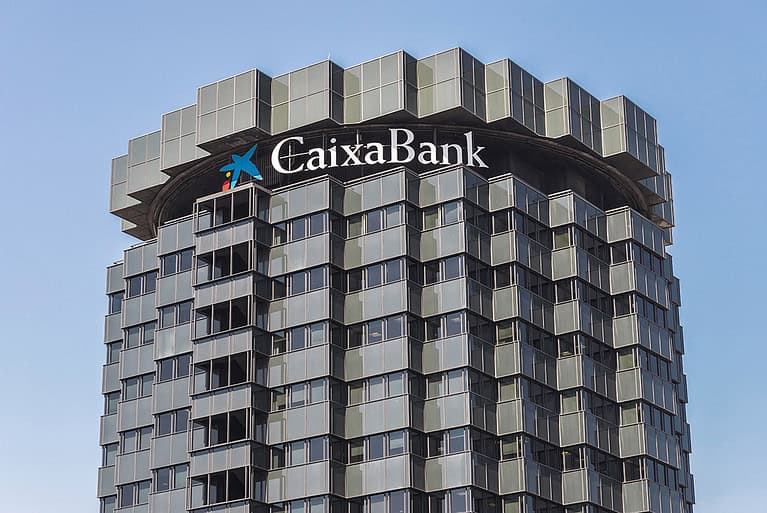
| Danske Bank | Financials |
|---|---|
| Jyske Bank | Financials |
| Møller-Maersk | Industrials, Transportation & Logistics |
| Orsted | Electric Utilities |
| Novo Nordisk | Pharmaceuticals |
| Vestas Wind Systems | Industrial Machinery & Equipment |
| Carlsberg | Consumer Staples, Beverages |
Major Trade Partners — Import
| Germany | 21% |
|---|---|
| Sweden | 13% |
| Netherlands | 8% |
| China | 8% |
| Poland | 4% |
Source: World Integrated Trade Solution
Major Trade Partners — Export
| Unspecified | 18% |
|---|---|
| Germany | 13% |
| Sweden | 9% |
| Norway | 6% |
| United Kingdom | 5% |
Source: World Integrated Trade Solution
Global Finance Rankings & Awards

Data Sources:
UN World Population Prospects
World Inequality Report
S&P Global Ratings
Moody’s
Fitch Ratings
IMF Direction of Trade Statistics (DOTS)
UN Conference on Trade and Development (UNCTAD)
CIA The World Factbook
World Bank’s World Integrated Trade Solution
Forbes Global 2000