Includes historical data for Equatorial Guinea’s Gross Domestic Product growth, debt-to-GDP ratio and more, as well as information on trade, banking and financial sector leadership.
Economy Powered By Foreign Investment In Oil Sector
An upper middle-income country with a population of about 1.6 million, Equatorial Guinea is one of the smallest nations on the continent and the only former Spanish colony in Sub-Saharan Africa. A member of the Economic Community of Central African States (ECCAS), Equatorial Guinea has historically benefited from foreign investment in the oil and gas sector, which accounts for a significant portion of government revenues. To diversify its economy and reduce dependency on oil, the government has identified agriculture, fishery, mining and tourism as critical target sectors.
However, despite some moderate progress, a lack of adequate economic reforms and incentives, along with cumbersome administrative procedures, pervasive corruption, and insufficient investment in critical infrastructure, continues to hinder entrepreneurial initiatives.
Macroeconomy & Sovereign Data
| Type of Government | Presidential republic |
|---|---|
| Capital | Malabo |
| Sovereign Ratings |
S&P: Not rated Moody’s: Not rated Fitch: Not rated |
| Total Population | 1.6 million |
| Median Age | 20.6 |
| Adult Per Capita Income (PPP) | 26,210.16 |
| Total GDP (2023) | 10.7 billion |
Equatorial Guinea GDP & Economic Overview
Most Recent Content
Equatorial Guinea

Emerging & Frontier Markets
Africa’s Mobile Banking: Boom Or Bust?
Capital Raising & Corporate Finance
THE OIL AND GAS WINDFALLAward Winners
World’s Best Banks 2013: Africa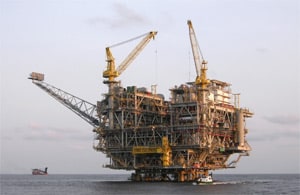
Banking
Africa: Oil & GasBanking & Finance
Trade & Investment
| Total Exports | USD 1.0 billion (2023) |
|---|---|
| Leading Exports |
Crude Petroleum Natural Gas Industrial Alcohols Lumber Veneer Sheeting |
| Total Imports | USD 8.0 billion (2022) |
| Leading Imports |
Gas Turbines Beer Ships Industrial Machinery Excavation Machinery |
| Source: | World Integrated Trade Solution |
Equatorial Guinea Leading Companies
| Banco Nacional de Guinea Ecuatorial | Financials |
|---|---|
| GEPetrol | Oil & Gas Exploration & Production |
| Sociedad Anonima Minera Guinea Ecuatorial | Materials, Metals & Mining |
| Compañía Ecuatoguineana de Cacao | Consumer Staples, Food Production |
| Matías Equatorial Guinea Holding Company | Conglomerate, Consumer Staples, Industrials |
| Sociedad Nacional de Correos y Telecomunicaciones | Telecommunication Services |
| Messonge | Construction & Engineering |
Global Finance Rankings & Awards


Data Sources:
UN World Population Prospects
World Inequality Report
S&P Global Ratings
Moody’s
Fitch Ratings
IMF Direction of Trade Statistics (DOTS)
UN Conference on Trade and Development (UNCTAD)
CIA The World Factbook
World Bank’s World Integrated Trade Solution
Forbes Global 2000