
Includes historical data for Estonia’s Gross Domestic Product growth, debt-to-GDP ratio and more, as well as information on trade, banking and financial sector leadership.
High-Tech Economy Attracts Strong Foreign Investment
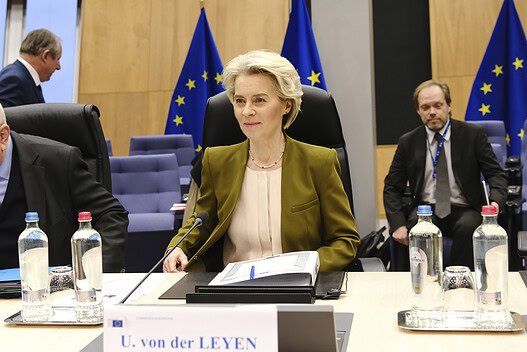
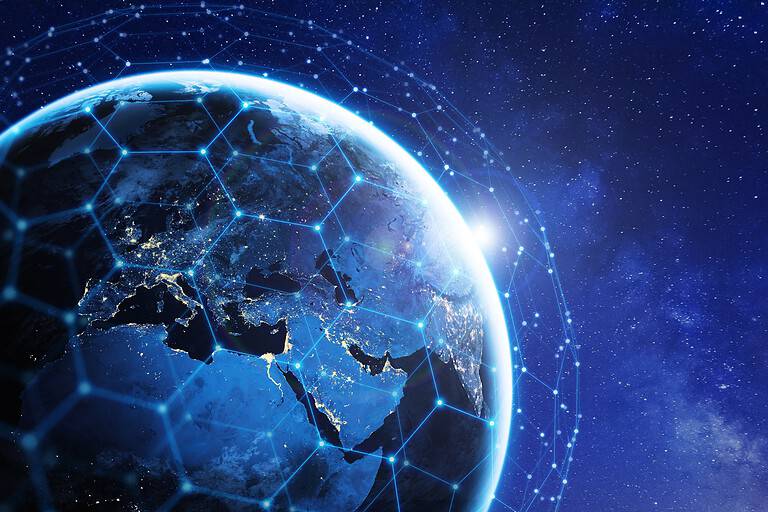
With a population of less than 1.5 million people, Estonia boasts a modern, dynamic, and highly developed economy supported by a transparent regulatory environment and a simple fiscal regime centered around a flat tax rate of 20%. A member of the EU, the Eurozone and NATO, Estonia enjoys one of the highest income rates and foreign investment levels on a per capita basis in Central Europe and the Baltic region. The Estonian government places a particular emphasis on fostering innovative and high-value-added sectors such as information and communication technology, green energy and smart cities. Its record-low public debt ratios, diverse energy sources, and close commercial and cultural ties with Finland, Sweden, and Germany further strengthen its economic standing.
Weaknesses include exposure to spillover effects from economic slowdowns affecting trading partners, income inequalities, and a shortage of both skilled and unskilled labor.
Macroeconomy & Sovereign Data
| Type of Government | Parliamentary republic |
|---|---|
| Capital | Tallinn |
| Sovereign Ratings |
S&P: AA– Moody’s: A1 Fitch: AA– |
| Total Population | 1.4 million |
| Median Age | 42.1 |
| Adult Per Capita Income (PPP) | 50,149.34 |
| Total GDP (2023) | 43.4 billion |
Estonia GDP & Economic Overview
Most Recent Content
Estonia
Economics, Policy & Regulation
Baltics Ditch Russia For Europe’s Power Grid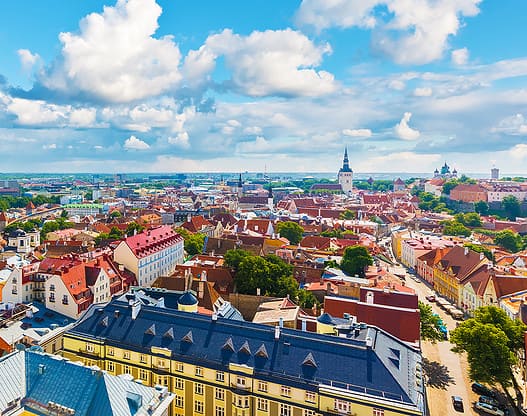
Emerging & Frontier Markets
Estonia: Rebuilding The Economy
Emerging & Frontier Markets
Estonia: Digital Economy Drives GrowthCapital Raising & Corporate Finance
Estonia: Tax Blessed—AgainBanking & Finance
Trade & Investment
| Total Exports | USD 27.9 billion (2023) |
|---|---|
| Leading Exports |
Broadcasting Equipment Coal Tar Oil Refined Petroleum Cars Prefabricated Buildings Lumber |
| Total Imports | USD 22.3 billion (2022) |
| Leading Imports |
Refined Petroleum Cars Coal Tar Oil Electricity Lumber Broadcasting Equipment |
| Source: | World Integrated Trade Solution |
Estonia Leading Companies
| Luminor Bank | Financials |
|---|---|
| Telia Eesti | Telecommunication Services |
| Tallinn Department Store | Consumer Discretionary Distribution & Retail |
| Eesti Energia | Electric Utilities |
| Tallink Grupp | Industrials, Marine Transportation |
| Bolt Technology | Transportation Services |
| BLRT Grupp | Construction & Engineering Services |
Major Trade Partners — Import
| Russia | 11% |
|---|---|
| Germany | 9% |
| China | 9% |
| Finland | 8% |
| Unspecified | 7% |
Source: World Integrated Trade Solution
Major Trade Partners — Export
| Finland | 14% |
|---|---|
| Latvia | 10% |
| United States | 9% |
| Sweden | 9% |
| Russia | 6% |
Source: World Integrated Trade Solution
Global Finance Rankings & Awards
Data Sources:
UN World Population Prospects
World Inequality Report
S&P Global Ratings
Moody’s
Fitch Ratings
IMF Direction of Trade Statistics (DOTS)
UN Conference on Trade and Development (UNCTAD)
CIA The World Factbook
World Bank’s World Integrated Trade Solution
Forbes Global 2000