Includes historical data for Fiji’s Gross Domestic Product growth, debt-to-GDP ratio and more, as well as information on trade, banking and financial sector leadership.
Diversified Economy: Agriculture And Exports
Situated in the middle of the South Pacific Ocean between Hawaii and New Zealand, the Republic of Fiji is more than a tourist destination. A key transportation and cultural hub for its neighboring island nations and the whole region, Fiji boasts a diverse economy, with strengths in agriculture, the garment industry, and exports such as bottled water and refined petroleum.
Fiji actively encourages foreign investment through tax incentives and free trade zones, particularly in the renewable energy and biofuel sectors. Efforts to reduce reliance on imported food products for its over 900,000 citizens are also underway.
However, challenges remain. The threat of natural disasters and a significant public debt burden pose concerns. Further, progress has been slow when it comes to strengthening governance, establishing an independent legal system and improving regulatory frameworks to support dynamic economic growth.
Macroeconomy & Sovereign Data
| Type of Government | Parliamentary republic |
|---|---|
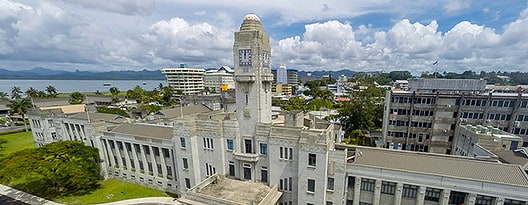
| Capital | Suva (on Viti Levu) |
| Sovereign Ratings |
S&P: B+ Moody’s: B1 Fitch: B+ |
| Total Population | 928,000 |
| Median Age | 28 |
| Adult Per Capita Income (PPP) | 20,289.01 |
| Total GDP (2025) | USD 6.34 billion |
Fiji GDP & Economic Overview
Most Recent Content
Fiji
Emerging & Frontier Markets
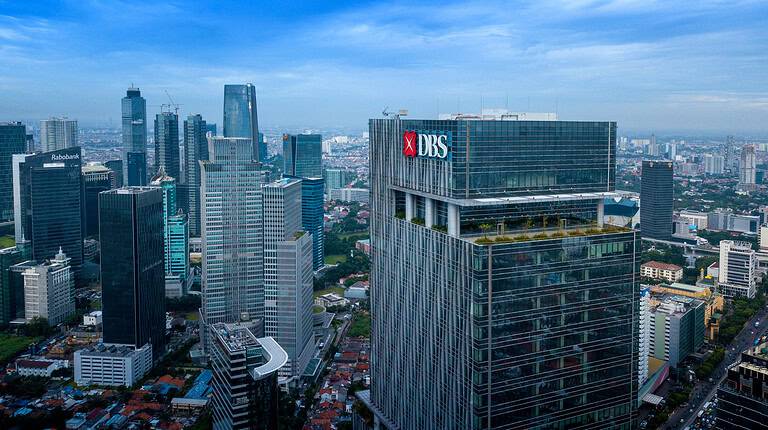
Regional Focus: Latin AmericaBanking & Finance
Trade & Investment
| Total Exports | USD 1.2 billion (2024) |
|---|---|
| Leading Exports |
Water Fish Raw Sugar Refined Petroleum Garments |
| Total Imports | USD 3.1 billion (2024) |
| Leading Imports |
Refined Petroleum Medical Instruments Cars Broadcasting Equipment Plastics |
| Source: | IMF, CIA The World Factbook |
Fiji Leading Companies
| Fiji Airways | Transportation, Airlines |
|---|---|
| Fiji National Provident Fund (FNPF) | Financials, Investment Management |
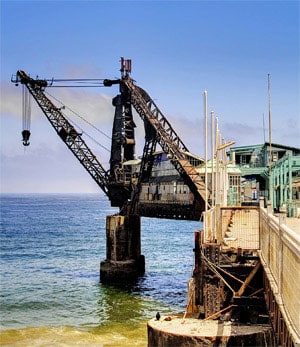
| The Fiji Ports Corporation Limited (FPCL) | Transportation, Marine Ports & Services |
| Carpenters Fiji | Consumer Staples, Consumer Discretionary |
| Turtle Airways | Transportation, Airlines |
| Fiji Water Company | Consumer Staples |
Major Trade Partners — Import
| Singapore | 25.7% |
|---|---|
| Australia | 15.4% |
| China | 15.0% |
| New Zealand | 13.6% |
| United States | 5.13% |
Major Trade Partners — Export
| United States | 19.9% |
|---|---|
| Bunkers | 11.79% |
| Australia | 9.73% |
| Tonga | 6.85% |
| Unspecified | 6.39% |
Global Finance Rankings & Awards


Data Sources:
UN World Population Prospects
World Inequality Report
S&P Global Ratings
Moody’s
Fitch Ratings
IMF Direction of Trade Statistics (DOTS)
UN Conference on Trade and Development (UNCTAD)
CIA The World Factbook
World Bank’s World Integrated Trade Solution
Forbes Global 2000