Includes historical data for Finland’s Gross Domestic Product growth, debt-to-GDP ratio and more, as well as information on trade, banking and financial sector leadership.
A Business-Friendly Environment
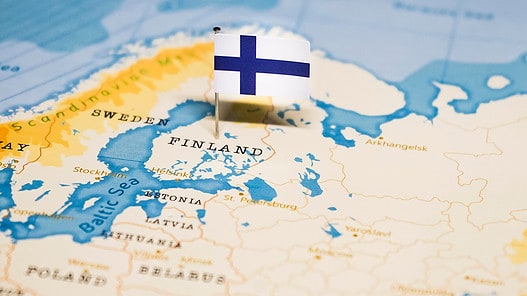
A member of the European Union and the Euro area, Finland boasts an exceptional quality of life, a modern and stable democracy, and a world-class investment climate. With excellent infrastructure, a highly skilled and multilingual workforce, and top-notch healthcare, education, and social services, this country of less than 6 million is a leader in the technology, telecommunications, and renewable energy sectors. Furthermore, Finland boasts the lowest corporate tax rate among Nordic countries and the EU as a whole, making it an attractive destination for international companies looking to optimize their tax liabilities.
Despite these strengths, Finland also faces challenges. An aging population, high tax rates, a rigid labor market and bureaucratic hurdles can deter investments and business initiatives. Finland’s vulnerability to international economic conditions, its proximity to Russia, and its banking sector’s dependence on the Danish and Swedish financial systems represent additional concerns.
Macroeconomy & Sovereign Data
| Type of Government | Parliamentary republic |
|---|---|
| Capital | Helsinki |
| Sovereign Ratings |
S&P: AA+ Moody’s: Aa1 Fitch: AA+ |
| Total Population | 5.6 million |
| Median Age | 43.0 |
| Adult Per Capita Income (PPP) | 61,575.44 |
| Total GDP (2023) | 308.1 billion |
Finland GDP & Economic Overview
Most Recent Content
Finland

Economics, Policy & Regulation
Finland: The Fight For Immigration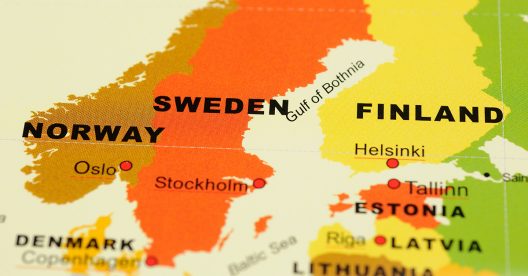
Technology
Nordic Lure For Data Center Investors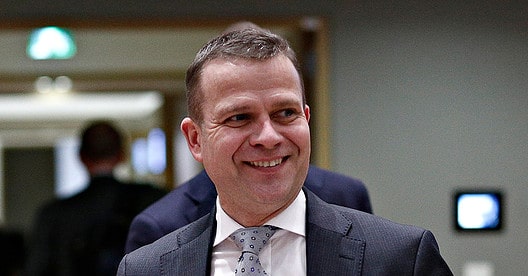
Economics, Policy & Regulation
Finland: Orpos Uphill Path To A New GovernmentBanking & Finance
Trade & Investment
| Total Exports | USD 90.7 billion (2023) |
|---|---|
| Leading Exports |
Refined Petroleum Kaolin-Coated Paper Cars Lumber Stainless Steel Wood Pulp |
| Total Imports | USD 94.5 billion (2022) |
| Leading Imports |
Cars And Vehicle Parts Crude Petroleum Refined Petroleum Broadcasting Equipment Packaged Medicines |
| Source: | World Integrated Trade Solution |
Finland Leading Companies
| Nordea Bank | Financials |
|---|---|
| Fortum | Electric Utilities |
| Sampo | Insurance |
| Nokia | Technology |
| Stora Enso | Materials, Paper & Forest Products |
| Neste | Oil & Gas Exploration & Production |
| Kesko | Consumer Staples, Food Retail |
Major Trade Partners — Import
| Germany | 15% |
|---|---|
| Russia | 12% |
| Sweden | 11% |
| China | 9% |
| Netherlands | 4% |
Source: World Integrated Trade Solution
Major Trade Partners — Export
| Germany | 13% |
|---|---|
| Sweden | 10% |
| United | 7% |
| Netherlands | 6% |
| Russia | 5% |
Source: World Integrated Trade Solution
Global Finance Rankings & Awards
Data Sources:
UN World Population Prospects
World Inequality Report
S&P Global Ratings
Moody’s
Fitch Ratings
IMF Direction of Trade Statistics (DOTS)
UN Conference on Trade and Development (UNCTAD)
CIA The World Factbook
World Bank’s World Integrated Trade Solution
Forbes Global 2000