
Includes historical data for Guyana’s Gross Domestic Product growth, debt-to-GDP ratio and more, as well as information on trade, banking and financial sector leadership.
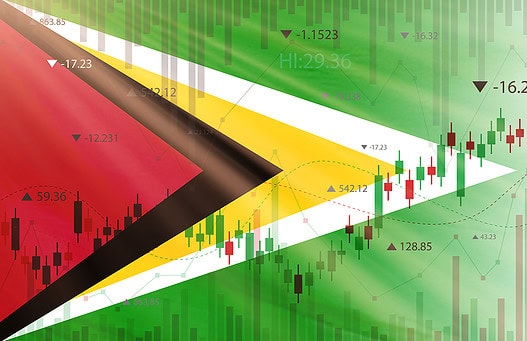
Economic Boom Driven By Oil Exports
Located on South America’s northern coast, Guyana is the continent’s sole nation with English as an official language. Until recently, the economy of this country of just 800,000 people relied heavily on exports of commodities such as sugar, rice, wood, gold and bauxite. However, in 2019, following the discovery of large offshore deposits, Guyana was propelled into the ranks of oil producers, triggering a period of astounding double-digit GDP growth projected to continue in the years ahead.
Despite its recent economic boom, Guyana confronts significant hurdles on its path toward achieving broad-based, sustainable development. An inefficient legal system and pervasive corruption continue to impede progress; and transportation, electricity, education and healthcare infrastructure remain inadequate. Reliance on foreign financing, a shortage of skilled workers and vulnerability to climate events such as hurricanes and floods present additional challenges.
Macroeconomy & Sovereign Data
| Type of Government | Parliamentary republic |
|---|---|
| Capital | Georgetown |
| Sovereign Ratings |
S&P: Not rated Moody’s: Not rated Fitch: Not rated |
| Total Population | 800,000 |
| Median Age | 26.3 |
| Adult Per Capita Income (PPP) | 58,259.47 |
| Total GDP (2023) | 21.2 billion |
Guyana GDP & Economic Overview
Most Recent Content
Guyana
Economics, Policy & Regulation
Guyana: Further Growth Predicted For Booming Economy
Capital Raising & Corporate Finance
IPOs Return To Latin America

Banking & Finance
Trade & Investment
| Total Exports | USD 4.2 billion (2023) |
|---|---|
| Leading Exports |
Crude Petroleum Gold Rice Aluminum Ores Railway Shipping Containers Rums |
| Total Imports | USD 10.8 billion (2022) |
| Leading Imports |
Floating Drilling Platforms Refined Petroleum Valves Construction Vehicles Cars |
| Source: | World Integrated Trade Solution |
Guyana Leading Companies
| Guyana Bank for Trade and Industry (GBTI) | Financials |
|---|---|
| Demerara Bank | Financials |
| Guyana Oil Company Limited | Oil & Gas Exploration & Production |
| Guyana Telephone and Telegraph Company (GT&T) | Telecommunication Services |
| Guyana Sugar Corporation | Consumer Staples, Sugar |
| Demerara Distillers | Consumer Staples, Brewers & Beverage Bottlers |
| Guyana Goldfields | Materials, Gold Mining |
Major Trade Partners — Import
| Singapore | 40% |
|---|---|
| United States | 20% |
| Trinidad and Tobago | 8% |
| China | 7% |
| Japan | 3% |
Major Trade Partners — Export
| United States | 42% |
|---|---|
| Singapore | 16% |
| United Arab Emirates | 7% |
| United Kingdom | 7% |
| Canada | 7% |
Global Finance Rankings & Awards

Data Sources:
UN World Population Prospects
World Inequality Report
S&P Global Ratings
Moody’s
Fitch Ratings
IMF Direction of Trade Statistics (DOTS)
UN Conference on Trade and Development (UNCTAD)
CIA The World Factbook
World Bank’s World Integrated Trade Solution
Forbes Global 2000