Includes historical data for Iran’s Gross Domestic Product growth, debt-to-GDP ratio and more, as well as information on trade, banking and financial sector leadership.
Strong Economic Potential Despite International Isolation
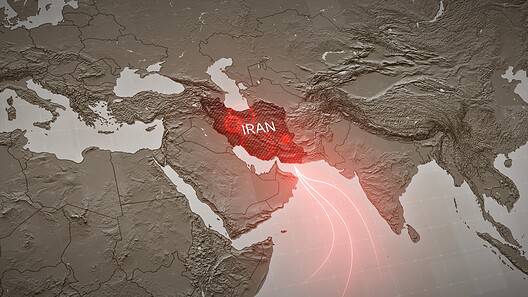
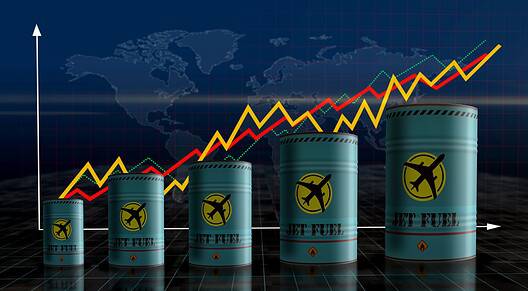
A nation rich in natural resources, Iran wrestles with complex economic realities. After a brief period of stabilization, the economy is once again losing momentum, weighed down by renewed pressure on oil and gas revenues. The country’s access to the global marketplace remains constricted due to international sanctions, and rampant inflation continues to erode purchasing power and deter investment.
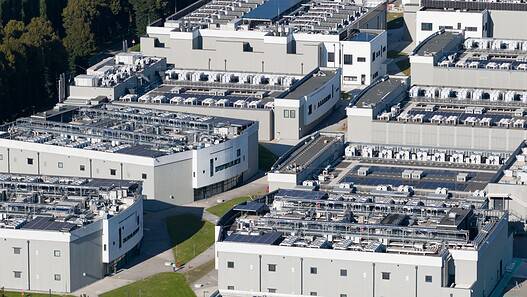
Despite these hurdles, great potential lies within the service, manufacturing and agriculture sectors. Iran also boasts a pool of skilled labor force in its young and educated population. Yet, the promise of this potential is overshadowed by high unemployment and widespread poverty, as well as complex bureaucracy and limited economic freedoms.
Macroeconomy & Sovereign Data
| Type of Government | Theocratic republic |
|---|---|
| Capital | Tehran |
| Sovereign Ratings |
S&P: N/A Moody’s: N/A Fitch Ratings: Rating watch |
| Total Population | 87.5 million |
| Median Age | 33.96 |
| Adult Per Capita Income (PPP) | 18,106.97 |
| Total GDP (2025) | 356.513 billion |
Iran GDP & Economic Overview
Most Recent Content
Iran

Banking & Finance
Trade & Investment
| Total Exports | USD 112.56 billion (2024) |
|---|---|
| Leading Exports |
Ethylene Polymers Refined Copper Acyclic Alcohols Aluminum Natural Gas |
| Total Imports | USD 69.41 billion (2024) |
| Leading Imports |
Broadcasting Equipment Corn Soybeans Vehicle Parts/Accessories Rice |
| Source: | World Integrated Trade Solution |
Iran Leading Companies
| Bank Melli | Financials |
|---|---|
| Bank Melat | Financials |
| National Iranian Oil Company | Oil & Gas Exploration & Production |
| Mobarakeh Steel Company | Materials, Metals & Mining |
| Iran Khodro | Automobiles & Components |
| Telecommunication Company of Iran | Telecommunication Services |
| Mapna Group | Construction & Engineering |
Major Trade Partners — Import
| United Arab Emirates | 31% |
|---|---|
| China | 27% |
| Turkey | 10% |
| India | 5% |
| Germany | 3% |
Source: World Integrated Trade Solution
Major Trade Partners — Export
| China | 28% |
|---|---|
| Other Asia, Unspecified | 16% |
| Unspecified | 14% |
| Iraq | 9% |
| United Arab Emirates | 7% |
Source: World Integrated Trade Solution
Global Finance Rankings & Awards


Data Sources:
UN World Population Prospects
World Inequality Report
S&P Global Ratings
Moody’s
Fitch Ratings
IMF Direction of Trade Statistics (DOTS)
UN Conference on Trade and Development (UNCTAD)
CIA The World Factbook
World Bank’s World Integrated Trade Solution
Forbes Global 2000