Includes historical data for Kyrgyz Republic’s Gross Domestic Product growth, debt-to-GDP ratio and more, as well as information on trade, banking and financial sector leadership.
Mineral And Energy Exports Central To Economy
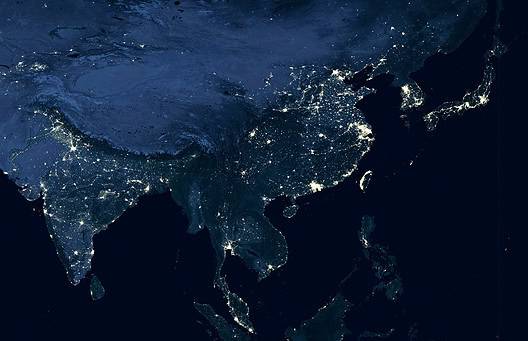
A landlocked mountainous nation nestled between China, Kazakhstan, Uzbekistan and Tajikistan, the Kyrgyz Republic, or Kyrgyzstan, is a mineral-based economy, with gold, mercury and natural gas as its primary exports. In recent years, the country has implemented market reforms to diversify its economic base and attract foreign investment through projects in tourism, information technology, hydroelectricity, and other sustainable growth industries.
Yet, it still faces hurdles, including a lack of administrative transparency, a fragile banking system, and regulatory inconsistencies that undermine investor confidence. Additionally, Kyrgyzstan also faces weaknesses such as vulnerability linked to its economic reliance on Russia and China, and a large share of informality in the labor market.
Macroeconomy & Sovereign Data
| Type of Government | Parliamentary republic |
|---|---|
| Capital | Bishkek |
| Sovereign Ratings |
S&P: Not rated Moody’s: B3 Fitch: Not rated |
| Total Population | 7.1 million |
| Median Age | 23.9 |
| Adult Per Capita Income (PPP) | 8,477.54 |
| Total GDP (2023) | USD 13.7 billion |
Kyrgyz Republic GDP & Economic Overview
Most Recent Content
Kyrgyz Republic
Economics, Policy & Regulation
Central Banker Report Cards 2024: Asia-PacificCapital Raising & Corporate Finance
ANNUAL SURVEY: WORLD’S BEST BANKS 2014

Banking
Regional Report: Central AsiaBanking & Finance
Trade & Investment
| Total Exports | USD 23.1 million (2022) |
|---|---|
| Leading Exports |
Gold Float Glass Precious Metals Kidney Beans Refined Petroleum Scrap Copper Dried Fruits |
| Total Imports | USD 1.5 billion (2022) |
| Leading Imports |
Refined Petroleum Footwear Clothing And Apparel Broadcasting Equipment Walnuts |
| Source: | IMF, CIA The World Factbook |
Kyrgyz Republic Leading Companies
| KomBank | Financials |
|---|---|
| Kyrgyzconsumoir bytbyt OJSC | Consumer Staples |
| Kyrgyz Telecom | Telecommunication Services |
| MegaCom | Telecommunication Services |
| Kyrgyz Railways | Transportation, Freight & Passenger Railways |
| Kumtor Gold Company | Materials, Metals & Mining |
Major Trade Partners — Import
| Russia | 34.3% |
|---|---|
| China | 26.1% |
| Kazakhstan | 11.9% |
| Türkiye | 5.8% |
| Uzbekistan | 5.9% |
Major Trade Partners — Export
| United Kingdom | 53.1% |
|---|---|
| Kazakhstan | 12.3% |
| Russia | 11.7% |
| Uzbekistan | 8.2% |
| Türkiye | 3.7% |
Global Finance Rankings & Awards


Data Sources:
UN World Population Prospects
World Inequality Report
S&P Global Ratings
Moody’s
Fitch Ratings
IMF Direction of Trade Statistics (DOTS)
UN Conference on Trade and Development (UNCTAD)
CIA The World Factbook
World Bank’s World Integrated Trade Solution
Forbes Global 2000