Includes historical data for Lithuania’s Gross Domestic Product growth, debt-to-GDP ratio and more, as well as information on trade, banking and financial sector leadership.
Efficient Business Regulations And Competitive Tax Rates Fuel Foreign Investment
A former Soviet republic, in just a few decades Lithuania has successfully transitioned to a modern, open-market, high-income economy. Strategically situated at the intersection of Europe and Eurasia, this nation of approximately 3 million people boasts a diversified and highly digitized economy, a well-educated multilingual workforce and a stable democratic government. Its membership in the EU and the Eurozone, coupled with an efficient regulatory framework, special incentives and equal treatment of both foreign and domestic enterprises, further bolsters its appeal to global investors.
However, Lithuania still faces challenges, including limited labor supply issues compounded by rapid wage growth and a sizable informal economy. Transportation barriers and the high ratio of low value-added exports are additional concerns.
Macroeconomy & Sovereign Data
| Type of Government | Semi-presidential republic |
|---|---|
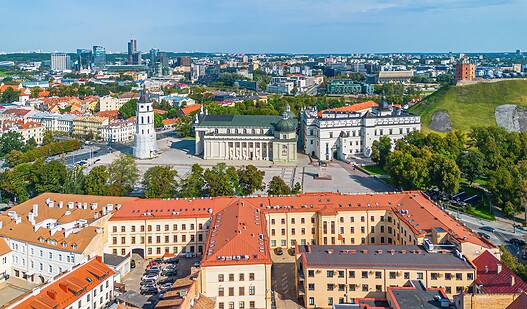
| Capital | Vilnius |
| Sovereign Ratings |
S&P: A+ Moody’s: A2 Fitch: A |
| Total Population | 2.9 million |
| Median Age | 44.3 |
| Adult Per Capita Income (PPP) | 52,145.16 |
| Total GDP (2023) | 81.2 billion |
Lithuania GDP & Economic Overview
Most Recent Content
Lithuania
Features
Lithuania: Punching Above Its Weight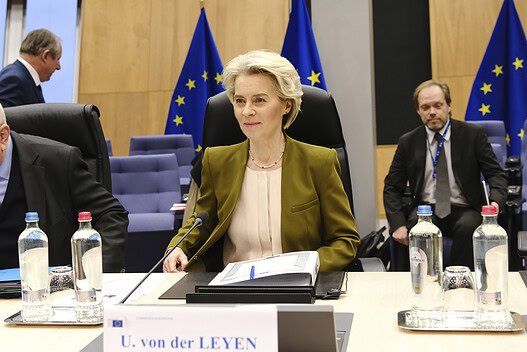
Economics, Policy & Regulation
Baltics Ditch Russia For Europe’s Power Grid
Country Report
Lithuania: Lure Of Free Trade Zones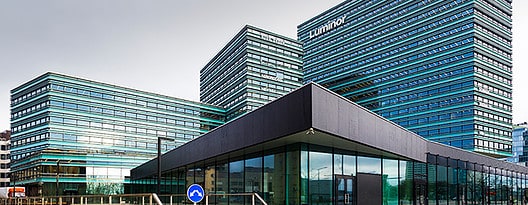
Capital Raising & Corporate Finance
Lithuania Lures FintechsBanking & Finance
Trade & Investment
| Total Exports | USD 48.5 billion (2023) |
|---|---|
| Leading Exports |
Refined Petroleum Wooden Furniture Wheat Laboratory Reagents Cigarettes |
| Total Imports | USD 42.7 billion (2022) |
| Leading Imports |
Crude Petroleum Cars Electricity Packaged Medicines Broadcasting Equipment Natural Gas |
| Source: | World Integrated Trade Solution |
Lithuania Leading Companies
| Šiaulių Bankas | Financials |
|---|---|
| Maxima Group | Consumer Staples, Food Retail |
| Telia Lietuva | Telecommunication Services |
| Achema | Materials, Chemicals |
| Ignitis | Electric Utilities |
| Apranga | Consumer Discretionary, Apparel Retail |
| Avia Solutions Group | Airlines |
Major Trade Partners — Import
| Germany | 13% |
|---|---|
| Poland | 12% |
| Russia | 12% |
| Latvia | 8% |
| Netherlands | 5% |
Source: World Integrated Trade Solution
Major Trade Partners — Export
| Russia | 11% |
|---|---|
| Latvia | 9% |
| Germany | 8% |
| Poland | 8% |
| United States | 6% |
Source: World Integrated Trade Solution
Global Finance Rankings & Awards
Data Sources:
UN World Population Prospects
World Inequality Report
S&P Global Ratings
Moody’s
Fitch Ratings
IMF Direction of Trade Statistics (DOTS)
UN Conference on Trade and Development (UNCTAD)
CIA The World Factbook
World Bank’s World Integrated Trade Solution
Forbes Global 2000