Includes historical data for Madagascar’s Gross Domestic Product growth, debt-to-GDP ratio and more, as well as information on trade, banking and financial sector leadership.
Economic Potential Undermined By Mismanagement
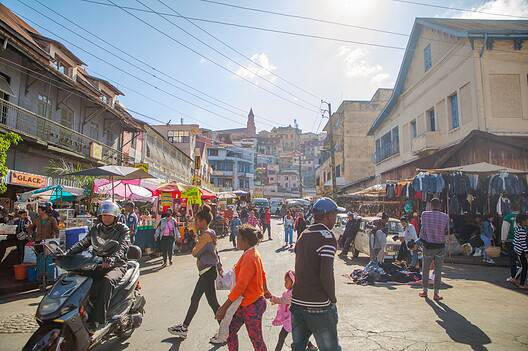
Situated in the Indian Ocean off the coast of southern Africa, Madagascar—the world’s fifth-largest island—is endowed with abundant mineral, agricultural and marine resources, and boasts a burgeoning tourism industry. With several trade agreements with the United States and the EU, in addition to memberships in various regional communities, Madagascar welcomes commercial partnerships and foreign investment.
Still, due to chronic political instability and mismanagement of the country’s finances and resources, the population faces persistently high poverty rates and widespread food insecurity. Foreign investors, despite laws granting them the same treatment as domestic investors, face additional scrutiny and unexplained delays. Additionally, convoluted administrative procedures, corruption and outdated labor laws undermine free economic activity. Inadequate infrastructure, as well as vulnerability to fluctuations in commodity prices and climatic hazards, compound the country’s woes.
Macroeconomy & Sovereign Data
| Type of Government | Semi-presidential republic |
|---|---|
| Capital | Antananarivo |
| Sovereign Ratings |
S&P: Not rated Moody’s: Not rated Fitch: Not rated |
| Total Population | 30.6 million |
| Median Age | 19.5 |
| Adult Per Capita Income (PPP) | 3,352.96 |
| Total GDP (2023) | 16.5 billion |
Madagascar GDP & Economic Overview
Most Recent Content
Madagascar
Economics, Policy & Regulation
Madagascar: A Country In Crisis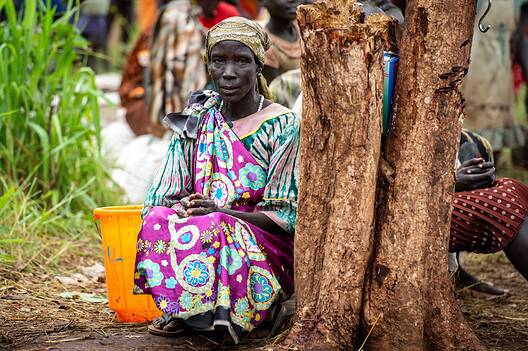
Economic Data
Poorest Countries in the World 2025
Economics, Policy & Regulation
Central Banker Report Cards 2024: Africa And The Middle East
Economics, Policy & Regulation
No Cause For Alarm: Q&A With Madagascar Central Bank Governor…Banking & Finance
Trade & Investment
| Total Exports | USD 4.2 billion (2023) |
|---|---|
| Leading Exports |
Vanilla Nickel Clothing And Apparel Titanium Gold Cloves |
| Total Imports | USD 4.8 billion (2022) |
| Leading Imports |
Refined Petroleum Rice Cars Packaged Medicines Clothing And Apparel |
| Source: | World Integrated Trade Solution |
Madagascar Leading Companies
| BNI Madagascar | Financials |
|---|---|
| Axian Group | Conglomerate, Energy, Real Estate, Telecommunication Services |
| Jirama | Utilities |
| Telma | Telecommunication Services |
| Socolait | Consumer Staples, Food Products |
| Ambatovy | Materials, Metals & Mining |
Major Trade Partners — Import
| China | 19% |
|---|---|
| France | 10% |
| Oman | 10% |
| India | 8% |
| United Arab Emirates | 6% |
Source: World Integrated Trade Solution
Major Trade Partners — Export
| France | 19% |
|---|---|
| United States | 18% |
| China | 13% |
| Japan | 9% |
| Netherlands | 5% |
Source: World Integrated Trade Solution
Global Finance Rankings & Awards


Data Sources:
UN World Population Prospects
World Inequality Report
S&P Global Ratings
Moody’s
Fitch Ratings
IMF Direction of Trade Statistics (DOTS)
UN Conference on Trade and Development (UNCTAD)
CIA The World Factbook
World Bank’s World Integrated Trade Solution
Forbes Global 2000