Includes historical data for Malawi’s Gross Domestic Product growth, debt-to-GDP ratio and more, as well as information on trade, banking and financial sector leadership.
Economic Growth Undermined By Poor Infrastructure
A landlocked nation in Southern Africa, Malawi shares borders with Mozambique, Zambia and Tanzania. With a rapidly growing population of about 23 million, Malawi benefits from rich agricultural resources, a burgeoning services sector, and significant potential in mining, energy, transportation, and information technology. Since gaining independence from Britain in 1964, the country has enjoyed stable governments, and sectarian and ethnic tensions common in the region are minimal.
Despite these advantages, most Malawians rely on subsistence farming, which is highly susceptible to weather shocks, and the country remains among the poorest in the world. On its path toward economic growth and stability, Malawi faces several challenges, including an inadequate infrastructure network, underdeveloped legal and commercial frameworks, widespread lack of transparency and corruption, and a scarcity of skilled and semi-skilled workers.
Macroeconomy & Sovereign Data
| Type of Government | Presidential republic |
|---|---|
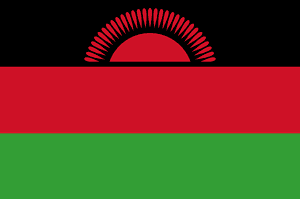
| Capital | Lilongwe |
| Sovereign Ratings |
S&P: Not rated Moody’s: Not rated Fitch: Rating watch |
| Total Population | 23.4 million |
| Median Age | 17.5 |
| Adult Per Capita Income (PPP) | 3,468.43 |
| Total GDP (2023) | 11.2 billion |
Malawi GDP & Economic Overview
Most Recent Content
Malawi
Economic Data
Poorest Countries in the World 2025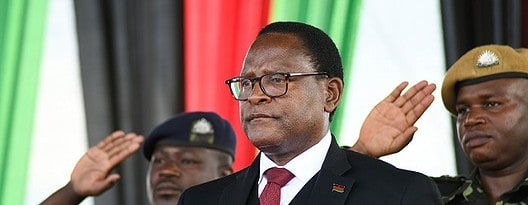

Emerging & Frontier Markets
JUMBE LATEST FINANCE MINISTER TO JUMP SHIP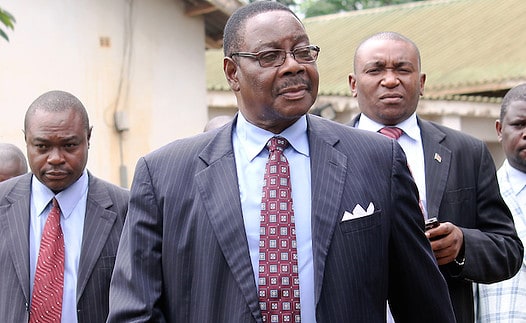
Capital Raising & Corporate Finance
MALAWI: NEW PRESIDENT BLESSING IN DISGUISE FOR FOREIGN DONORSBanking & Finance
Trade & Investment
| Total Exports | USD 1.8 billion (2023) |
|---|---|
| Leading Exports |
Tobacco Gold Soybeans Raw Sugar Tea Dried Legumes And Nuts |
| Total Imports | USD 1.1 billion (2022) |
| Leading Imports |
Postage Stamps Refined Petroleum Packaged Medicines Fertilizers Office Machinery/Parts |
| Source: | World Integrated Trade Solution |
Malawi Leading Companies
| National Bank of Malawi | Financials |
|---|---|
| FDH Banks | Financials |
| Press Corporation | Conglomerate, Financials, Real Estate, Telecommunication Services |
| Illovo Sugar | Consumer Staples, Food Products |
| Malawi Telecommunications | Telecommunication Services |
| Escom | Utilities |
Major Trade Partners — Import
| China | 18% |
|---|---|
| South Africa | 18% |
| United Arab Emirates | 9% |
| India | 7% |
| Zambia | 3% |
Source: World Integrated Trade Solution
Major Trade Partners — Export
| Belgium | 14% |
|---|---|
| India | 8% |
| Tanzania | 7% |
| South Africa | 7% |
| United Arab Emirates | 5% |
Source: World Integrated Trade Solution
Global Finance Rankings & Awards


Data Sources:
UN World Population Prospects
World Inequality Report
S&P Global Ratings
Moody’s
Fitch Ratings
IMF Direction of Trade Statistics (DOTS)
UN Conference on Trade and Development (UNCTAD)
CIA The World Factbook
World Bank’s World Integrated Trade Solution
Forbes Global 2000