Includes historical data for Moldova’s Gross Domestic Product growth, debt-to-GDP ratio and more, as well as information on trade, banking and financial sector leadership.
Low Foreign Investment Despite Free Trade Agreements
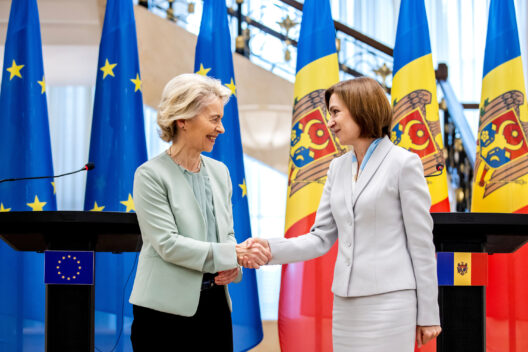
A former Soviet republic, in recent years Moldova has made remarkable progress in strengthening its democratic institutions and improving its business environment. With inexpensive labor, free trade agreements with the EU, and commercial laws aligned with WTO standards, the government actively courts foreign investment through tax incentives and other measures.
However, despite considerable potential across the finance, automotive, information technology, agriculture and agro-food sectors, foreign direct investment (FDI) has remained low. Bureaucratic hurdles, cronyism, a sizable informal economy, and low productivity rates hinder investment prospects. Moldova also grapples with a lack of skilled workers and dependence on remittances and international aid. Additionally, as a small economy heavily dependent on trade with Ukraine, Russia and Belarus, Moldova has faced severe repercussions from Russia’s full-scale invasion of Ukraine, including energy crises and unprecedented inflation rates.
Macroeconomy & Sovereign Data
| Type of Government | Parliamentary republic |
|---|---|
| Capital | Chisinau in Romanian (Kishinev in Russian) |
| Sovereign Ratings |
S&P: Not rated Moody’s: B3 Fitch: Not rated |
| Total Population | 2.5 million |
| Median Age | 35.5 |
| Adult Per Capita Income (PPP) | 16,264.03 |
| Total GDP (2023) | 18.4 billion |
Moldova GDP & Economic Overview
Most Recent Content
Moldova
Economics, Policy & Regulation
Moldova: Direction In Doubt
Capital Raising & Corporate Finance
ANNUAL SURVEY: WORLD’S BEST BANKS 2014
Banking & Finance
Trade & Investment
| Total Exports | USD 9.3 billion (2023) |
|---|---|
| Leading Exports |
Insulated Wiring Sunflower Seeds Wine Corn Seats |
| Total Imports | USD 4.2 billion (2022) |
| Leading Imports |
Refined Petroleum Cars Insulated Wiring Packaged Medicines Broadcasting Equipment |
| Source: | World Integrated Trade Solution |
Moldova Leading Companies
| Moldova Agroindbank | Financials |
|---|---|
| Fidesco Group | Consumer Discretionary, Food Retail |
| Moldtelecom | Telecommunication Services |
| Daac Hermes Grup | Conglomerate, Industrials, Financials, Food Products |
| Jurnal Trust Media Group | Media, Publishing |
| Nistru-Struguraș | Consumer Staples, Wineries |
| FlyOne | Airlines |
Major Trade Partners — Import
| Russia | 15% |
|---|---|
| China | 12% |
| Romania | 12% |
| Ukraine | 9% |
| Germany | 8% |
Source: World Integrated Trade Solution
Major Trade Partners — Export
| Romania | 27% |
|---|---|
| Türkiye | 10% |
| Russia | 9% |
| Germany | 8% |
| Italy | 8% |
Source: World Integrated Trade Solution
Global Finance Rankings & Awards


Data Sources:
UN World Population Prospects
World Inequality Report
S&P Global Ratings
Moody’s
Fitch Ratings
IMF Direction of Trade Statistics (DOTS)
UN Conference on Trade and Development (UNCTAD)
CIA The World Factbook
World Bank’s World Integrated Trade Solution
Forbes Global 2000