
Includes historical data for Mongolia’ Gross Domestic Product growth, debt-to-GDP ratio and more, as well as information on trade, banking and financial sector leadership.
Economic Boom Based On Mineral Exports
Over the past few decades, Mongolia has undergone a remarkable economic transformation. Once heavily reliant on herding and agriculture, the country has shifted gears, capitalizing on its vast deposits of gold, copper, coal and other minerals. As a result, the country’s GDP per capita has tripled since the early 1990s, foreign direct investment has boomed, and significant progress has been made in poverty reduction. Mongolia’s strategic location between China, Europe, and Russia has further bolstered its export potential.
Today, the government is actively pursuing efforts to liberalize markets and foster a competitive financial sector, as well as to diversify the economy through investments in agri-food, digital services and tourism. Yet, Mongolia still faces challenges in creating a consistent and transparent business environment. As a small landlocked economy, it also remains vulnerable to external economic shocks, commodity price fluctuations, and Chinese and Russian demand. Furthermore, despite the progress made, about a fourth of the population still lives below the national poverty line.
Macroeconomy & Sovereign Data
| Type of Government | Semi-presidential republic |
|---|---|
| Capital | Ulaanbaatar |
| Sovereign Ratings |
S&P: BB- Moody’s: B1 Fitch: B+ |
| Total Population | 3.6 million |
| Median Age | 27 |
| Adult Per Capita Income (PPP) | 28,565.7 |
| Total GDP (2023) | USD 25.1 billion |
Mongolia GDP & Economic Overview
Most Recent Content
Mongolia

Executive Interviews
Byadran Lkhagvasuren: Pursuing Economic Diversity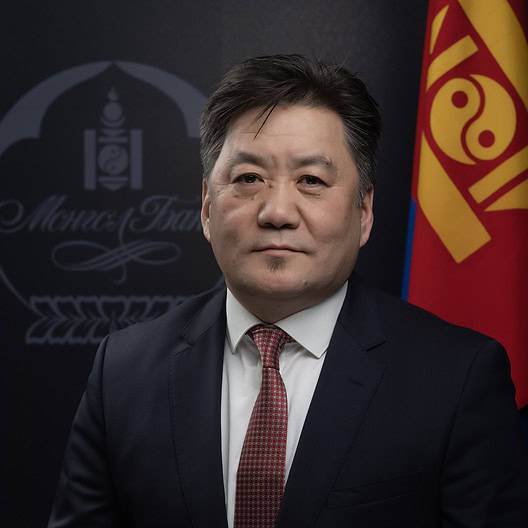
Economics, Policy & Regulation
Growth And Restructuring: Q&A With Mongolia’s Central Bank Governor Byadran…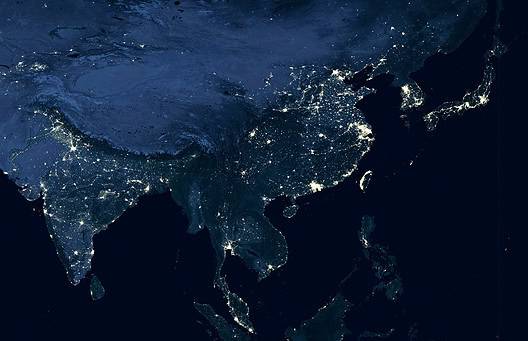
Economics, Policy & Regulation
Central Banker Report Cards 2024: Asia-Pacific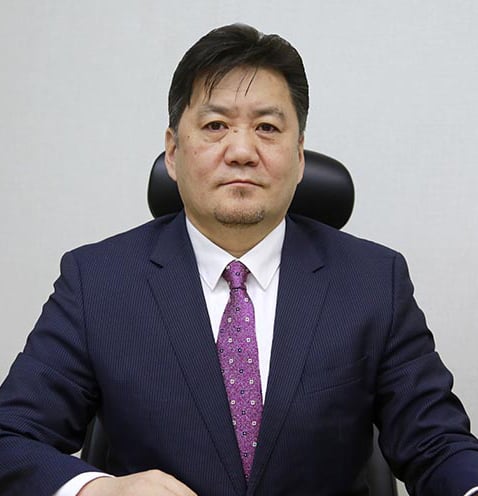
Economics, Policy & Regulation
Goals Of Growth: Q&A With Mongolia Central Bank Governor Byadran…Banking & Finance
Trade & Investment
| Total Exports | USD 16.4 billion (2024) |
|---|---|
| Leading Exports |
Copper Ore Coal Gold Iron Ore Crude Petroleum |
| Total Imports | USD 14.5 billion (2024) |
| Leading Imports |
Cars Trucks Trailers Tractors Construction Vehicles |
| Source: | IMF, CIA The World Factbook |
Mongolia Leading Companies
| Khan Bank | Financials |
|---|---|
| Trade and Development Bank of Mongolia | Financials |
| Erdenet Mining Corporation (EMC) | Materials, Copper Producers |
| Oyu Tolgoi LLC | Materials, Copper & Gold Producers |
| Mongolian National Oil Company (MNOC) | Energy, Exploration & Production |
| Energy Resource | Materials, Coal Mining |
| MacTel | Telecommunication Services |
Major Trade Partners — Import
| China | 34.8% |
|---|---|
| Russia | 30.3% |
| Japan | 7.71% |
| South Korea | 4.86% |
| United States | 3.03% |
Major Trade Partners — Export
| China | 84.3% |
|---|---|
| Switzerland | 8.21% |
| Singapore | 2.75% |
| South Korea | 2.02% |
| Russia | 0.89% |
Global Finance Rankings & Awards


Data Sources:
UN World Population Prospects
World Inequality Report
S&P Global Ratings
Moody’s
Fitch Ratings
IMF Direction of Trade Statistics (DOTS)
UN Conference on Trade and Development (UNCTAD)
CIA The World Factbook
World Bank’s World Integrated Trade Solution
Forbes Global 2000