Includes historical data for Morocco’s Gross Domestic Product growth, debt-to-GDP ratio and more, as well as information on trade, banking and financial sector leadership.
A Thriving, Diversified Export-Driven Economy
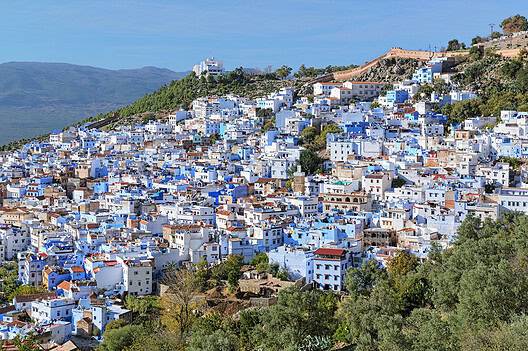
An economic powerhouse of the African continent, the Kingdom of Morocco sits at the crossroads of Europe, Sub-Saharan Africa and the Middle East. With a population of over 37 million people, Morocco benefits from its stable political environment, modern infrastructure and well-developed financial markets. Furthermore, the country has embarked on an ambitious reform program aimed at boosting private sector initiative and job creation, diversifying the economy, and attracting foreign investment. A successful regional manufacturing and export hub for international companies, particularly in the automotive industry, other thriving drivers of the economy include sectors such as tourism, mining, textiles and clothing, renewable energy, and information technology.
Morocco, however, also confronts several challenges, including rural poverty, youth unemployment, heavy dependence on agriculture, and vulnerability to climatic shocks. Furthermore, the country relies significantly on the European Union for its tourism and industrial sectors. Additionally, Morocco struggles with burdensome bureaucracy, weak productivity, and labor market rigidities, which stifle the country’s potential for full economic growth and development.
Macroeconomy & Sovereign Data
| Type of Government | Parliamentary constitutional monarchy |
|---|---|
| Capital | Rabat |
| Sovereign Ratings |
S&P: BB+ Moody’s: Ba1 Fitch: BB+ |
| Total Population | 37.4 million |
| Median Age | 29.6 |
| Adult Per Capita Income (PPP) | 14,760.66 |
| Total GDP (2023) | 152.4 billion |
Morocco GDP & Economic Overview
Most Recent Content
Morocco
Emerging & Frontier Markets
North Africa: On The Rise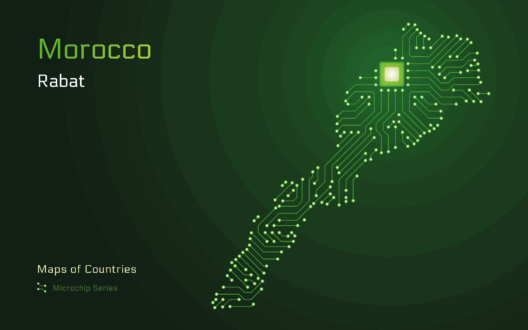
Emerging & Frontier Markets
Morocco: Boom In Data Centers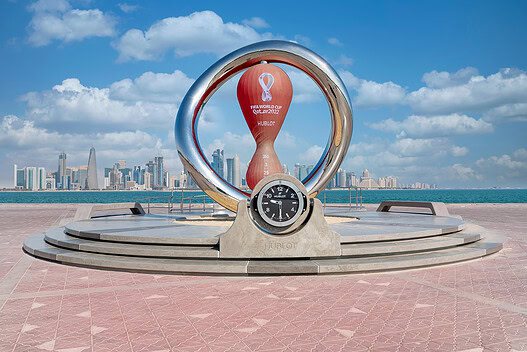
Capital Raising & Corporate Finance
Green Flag For MENA Sports Investment
Banking & Finance
Trade & Investment
| Total Exports | USD 63.5 billion (2023) |
|---|---|
| Leading Exports |
Cars Fertilizers Insulated Wiring Phosphoric Acid Clothing And Apparel |
| Total Imports | USD 43.6 billion (2022) |
| Leading Imports |
Refined Petroleum Cars And Vehicle Parts Natural Gas Wheat Coal |
| Source: | World Integrated Trade Solution |
Morocco Leading Companies
| Attijariwafa Bank | Financials |
|---|---|
| Banque Centrale Populaire | Financials |
| OCP Group | Materials, Metals & Mining |
| Maroc Telecom | Telecommunication Services |
| Cosumar | Consumer Staples, Food Products |
| Akwa Group | Conglomerate, Oil & Gas, Retail, Real Estate |
| Al Mada | Conglomerate, Financials, Consumer Staples, Energy |
Major Trade Partners — Import
| Spain | 16% |
|---|---|
| China | 12% |
| France | 11% |
| United States | 7% |
| Türkiye | 6% |
Source: World Integrated Trade Solution
Major Trade Partners — Export
| Spain | 22% |
|---|---|
| France | 21% |
| Brazil | 6% |
| India | 5% |
| Italy | 4% |
Source: World Integrated Trade Solution
Global Finance Rankings & Awards


Data Sources:
UN World Population Prospects
World Inequality Report
S&P Global Ratings
Moody’s
Fitch Ratings
IMF Direction of Trade Statistics (DOTS)
UN Conference on Trade and Development (UNCTAD)
CIA The World Factbook
World Bank’s World Integrated Trade Solution
Forbes Global 2000