Includes historical data for Namibia’s Gross Domestic Product growth, debt-to-GDP ratio and more, as well as information on trade, banking and financial sector leadership.
Resource-Rich And Favorable Investment Climate
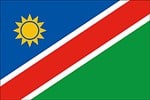
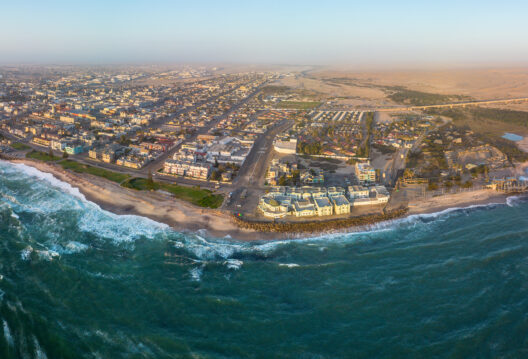
Bordering South Africa, Botswana, Zambia and Angola, this nation of about 2.7 million people boasts a strategic location along the South Atlantic, rich mineral resources, and stable governance since gaining independence from South Africa in 1990. Its favorable investment climate is supported by a robust infrastructure network, well-developed financial markets, and the peg of the Namibian dollar to the South African rand. Foreign investors and local firms enjoy equal treatment, with historically significant investment in the mining, fishing, and tourism sectors by international companies. Renewable energies, banking, logistics, and manufacturing also attract investment.
Despite these strengths, Namibia faces significant challenges. Lack of sustained support from governmental policies and deficient judicial frameworks limit growth prospects. High unemployment rates, persistent socioeconomic inequalities, and the nation’s reliance on South Africa and the mining sector pose additional economic vulnerabilities. The agricultural sector is highly susceptible to climatic hazards.
Macroeconomy & Sovereign Data
| Type of Government | Presidential republic |
|---|---|
| Capital | Windhoek |
| Sovereign Ratings |
S&P: Not rated Moody’s: B1 Fitch: BB |
| Total Population | 2.7 million |
| Median Age | 21.5 |
| Adult Per Capita Income (PPP) | 19,577.18 |
| Total GDP (2023) | 12.8 billion |
Namibia GDP & Economic Overview
Most Recent Content
Namibia
Economics, Policy & Regulation
Namibia Historic Election Seats First Female President
Economics, Policy & Regulation
Central Banker Report Cards 2024: Africa And The Middle East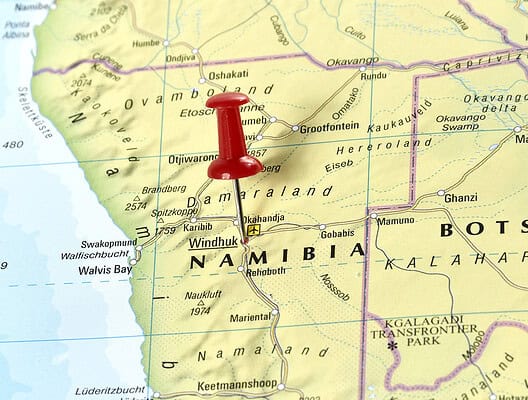
Transaction Banking
Namibia And NIPL Ink Instant Payments DealAwards
BEST BANKS 2014: AFRICABanking & Finance
Trade & Investment
| Total Exports | USD 6.0 billion (2023) |
|---|---|
| Leading Exports |
Diamonds Uranium Copper Gold Fish Products Aircraft Ships |
| Total Imports | USD 3.7 billion (2022) |
| Leading Imports |
Copper Refined Petroleum Delivery Trucks Cobalt Cars |
| Source: | World Integrated Trade Solution |
Namibia Leading Companies
| Development Bank of Namibia | Financials |
|---|---|
| Bank Windhoek | Financials |
| Nampower | Utilities |
| Namdeb Diamond | Materials, Metals & Mining |
| Mobile Telecommunications MTC | Telecommunication Services |
| Ohlthaver & List | Conglomerate, Food Staples, Retail, Real Estate |
| Namibia Breweries | Consumer Staples, Brewers |
Major Trade Partners — Import
| South Africa | 32% |
|---|---|
| Zambia | 14% |
| Democratic Republic of the Congo | 7% |
| China | 5% |
| Germany | 4% |
Source: World Integrated Trade Solution
Major Trade Partners — Export
| Unspecified | 56% |
|---|---|
| Zambia | 18% |
| Democratic Republic of the Congo | 8% |
| Germany | 5% |
| South Africa | 4% |
Source: World Integrated Trade Solution
Global Finance Rankings & Awards


Data Sources:
UN World Population Prospects
World Inequality Report
S&P Global Ratings
Moody’s
Fitch Ratings
IMF Direction of Trade Statistics (DOTS)
UN Conference on Trade and Development (UNCTAD)
CIA The World Factbook
World Bank’s World Integrated Trade Solution
Forbes Global 2000