
Includes historical data for Pakistan’s Gross Domestic Product growth, debt-to-GDP ratio and more, as well as information on trade, banking and financial sector leadership.
Agriculture And Textile Exports Key To Growth
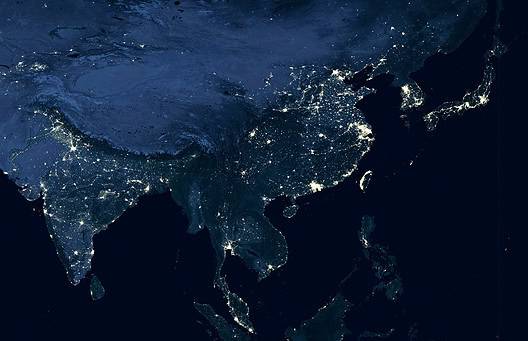
Strategically positioned between China and India and serving as a gateway to the Indian Ocean, Pakistan boasts a large domestic market buoyed by remittance inflows, a cost-effective English-speaking labor force, and significant natural resources. While agricultural goods, textiles and apparel remain the primary sources of export revenue, economic diversification efforts toward minerals, consumer goods, digital and financial services, and tourism hold promise.
Yet, while the country is open to foreign direct investment (FDI), international investors are faced with opaque regulations, an underdeveloped financial sector, and inadequate infrastructure. Other weaknesses include the prevalence of a large informal sector and a low literacy rate, reliance on imports, geopolitical tensions and security concerns.
Macroeconomy & Sovereign Data
| Type of Government | Federal parliamentary republic |
|---|---|
| Capital | Islamabad |
| Sovereign Ratings |
S&P: CCC+ Moody’s: Caa3 Fitch: CCC |
| Total Population | 236.2 million |
| Median Age | 20.6 |
| Adult Per Capita Income (PPP) | 12,285.09 |
| Total GDP (2023) | USD 340.6 billion |
Pakistan GDP & Economic Overview
Most Recent Content
Pakistan
Economics, Policy & Regulation
Central Banker Report Cards 2024: Asia-Pacific
Economics, Policy & Regulation
Pakistan: Political Rookie Steps Up As Finance Minister
Emerging & Frontier Markets
Pakistan: Post-Pandemic Bump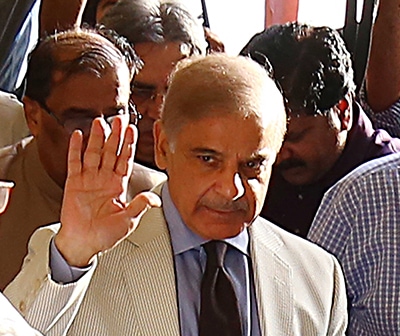
Banking & Finance
Trade & Investment
| Total Exports | USD 73.3 billion (2022) |
|---|---|
| Leading Exports |
Textiles Clothing And Apparel Rice Leather Goods Surgical Instruments |
| Total Imports | USD 34.1 billion (2022) |
| Leading Imports |
Refined Petroleum Crude Petroleum Natural Gas Palm Oil Scrap Iron |
| Source: | IMF, CIA The World Factbook |
Pakistan Leading Companies
| National Bank of Pakistan | Financials |
|---|---|
| United Bank | Financials |
| Habib Bank | Financials |
| MCB Bank | Financials |
| Pakistan State Oil (PSO) | Energy, Integrated Oil & Gas |
| Engro Corporation | Industrials, Chemicals |
| Pakistan Mobile Communications | Telecommunication Services |
Major Trade Partners — Import
| China | 28.3% |
|---|---|
| United Arab Emirates | 10.1% |
| Indonesia | 5.8% |
| United States | 5.3% |
| Saudi Arabia | 5.2% |
Major Trade Partners — Export
| United States | 21.1% |
|---|---|
| China | 10.5% |
| United Kingdom | 7.3% |
| Germany | 5.4% |
| Netherlands | 4.9% |
Global Finance Rankings & Awards


Data Sources:
UN World Population Prospects
World Inequality Report
S&P Global Ratings
Moody’s
Fitch Ratings
IMF Direction of Trade Statistics (DOTS)
UN Conference on Trade and Development (UNCTAD)
CIA The World Factbook
World Bank’s World Integrated Trade Solution
Forbes Global 2000