
Includes historical data for Panama’s Gross Domestic Product growth, debt-to-GDP ratio and more, as well as information on trade, banking and financial sector leadership.
A Dollar-Based Economy And FDI Hub
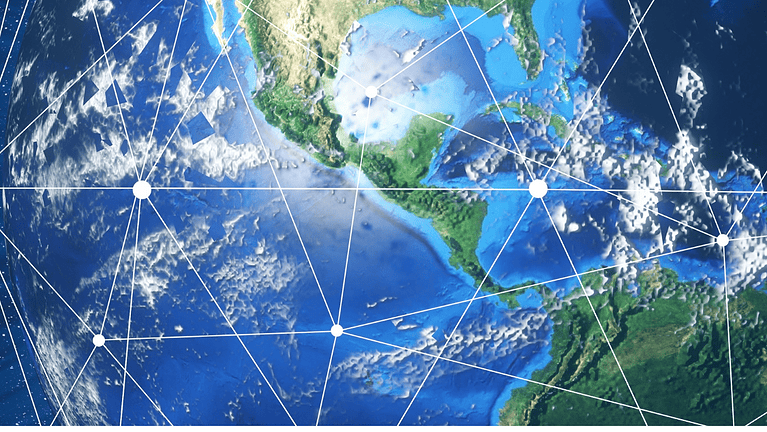
Situated on the thin stretch of land that connects North and South America, Panama boasts ports on both oceans and serves as the passageway for 10% of world maritime traffic. The Panama Canal, the world’s second-largest free trade zone, attracts substantial foreign direct investment and bolsters the country’s status as a regional banking and financial center. Panama’s dollar-based economy, low inflation and stable democratic government further enhance its appeal. Additionally, Panama has sustained some of the highest economic growth rates in Central America for the past few decades.
However, Panama also faces challenges. Despite its status as an upper-middle-income economy, inequality among its 4.5 million inhabitants persists, exacerbated by unemployment and a lack of skilled labor. High debt levels, corruption and exposure to both North and South American economic shocks pose additional concerns.
Macroeconomy & Sovereign Data
| Type of Government | Parliamentary republic |
|---|---|
| Capital | Panama City |
| Sovereign Ratings |
S&P: BBB Moody’s: Baa3 Fitch: BB+ |
| Total Population | 4.5 million |
| Median Age | 29.6 |
| Adult Per Capita Income (PPP) | 49,655.17 |
| Total GDP (2023) | 87.3 billion |
Panama GDP & Economic Overview
Most Recent Content
Panama
Capital Raising & Corporate Finance
BAC Eyes Panama’s Multibank Deal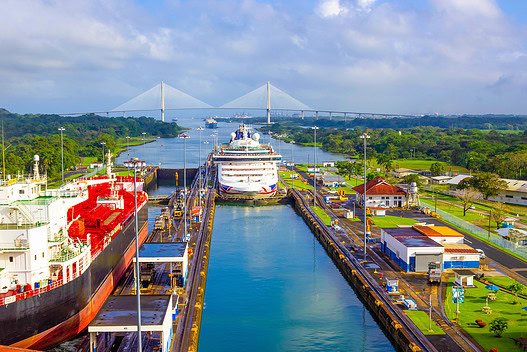

Economics, Policy & Regulation
Latin America Adopts Dual CurrenciesBanking & Finance
Trade & Investment
| Total Exports | USD 65.6 billion (2023) |
|---|---|
| Leading Exports |
Refined Petroleum Copper Bananas Ships Coal Tar Oil Packaged Medicines |
| Total Imports | USD 8.8 billion (2022) |
| Leading Imports |
Ships Refined Petroleum Crude Petroleum Tanker Ships Packaged Medicines |
| Source: | World Integrated Trade Solution |
Panama Leading Companies
| BAC International Bank | Financials |
|---|---|
| Banco General | Financials |
| Banco Nacional de Panama | Financials |
| Copa Airlines | Airlines |
| Panamanian Ports Company | Industrials, Ports & Shipping |
| Grupo Rey | Food & Staples Retailing |
| Cervecería Nacional | Consumer Staples, Breweries |
Major Trade Partners — Import
| United States | 26% |
|---|---|
| Free zones (unspecified) | 23% |
| China | 12% |
| Mexico | 5% |
| Costa Rica | 4% |
Major Trade Partners — Export
| China | 32% |
|---|---|
| Japan | 13% |
| South Korea | 10% |
| Spain | 9% |
| India | 5% |
Global Finance Rankings & Awards

Data Sources:
UN World Population Prospects
World Inequality Report
S&P Global Ratings
Moody’s
Fitch Ratings
IMF Direction of Trade Statistics (DOTS)
UN Conference on Trade and Development (UNCTAD)
CIA The World Factbook
World Bank’s World Integrated Trade Solution
Forbes Global 2000