Includes historical data for Peru’s Gross Domestic Product growth, debt-to-GDP ratio and more, as well as information on trade, banking and financial sector leadership.
Strong Economic Growth Underpinned By Sound Policies
Peru has a history of robust economic growth underpinned by a tradition of sound fiscal and macroeconomic policies. With a population of approximately 35 million, the country benefits from abundant mineral and energy reserves, agricultural resources and fisheries. Peru welcomes foreign direct investment (FDI) by granting national treatment to foreign investors and maintains strong integration within the global economy through various bilateral and multilateral trade agreements.
However, recent years have seen increased levels of political instability and related social conflict, negatively impacting investor confidence and growth prospects. Additionally, overdependence on raw material exports, inadequate infrastructure, along a significant informal sector leading to weak fiscal revenues, pose additional challenges. Complex bureaucracy and regulatory inefficiencies, compounded by a lack of transparency and an underdeveloped credit system, further stifle private-sector growth.
Macroeconomy & Sovereign Data
| Type of Government | Presidential republic |
|---|---|
| Capital | Lima |
| Sovereign Ratings |
S&P: BBB Moody’s: Baa1 Fitch: BBB |
| Total Population | 34.1 million |
| Median Age | 29.1 |
| Adult Per Capita Income (PPP) | 19,475.15 |
| Total GDP (2023) | 282.5 billion |
Peru GDP & Economic Overview
Most Recent Content
Peru
Economics, Policy & Regulation
Latin America: Looking For Silver Linings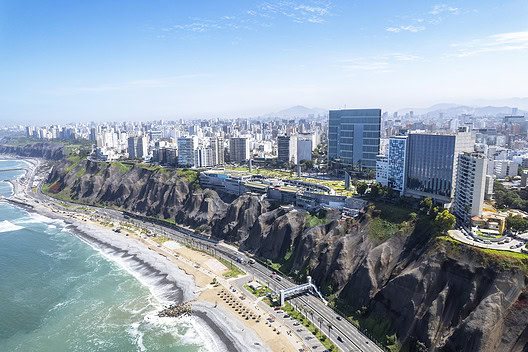
Emerging & Frontier Markets
Peru: A Stable Latin American Hub
Economics, Policy & Regulation
Central Banker Report Cards 2024: The Americas
Capital Raising & Corporate Finance
IPOs Return To Latin AmericaBanking & Finance
Trade & Investment
| Total Exports | USD 48.8 billion (2023) |
|---|---|
| Leading Exports |
Copper Gold Refined Petroleum Zinc Fishmeal Tropical Fruits |
| Total Imports | USD 71.1 billion (2022) |
| Leading Imports |
Refined Petroleum Crude Petroleum Cars Broadcasting Equipment Delivery Trucks |
| Source: | World Integrated Trade Solution |
Peru Leading Companies
| Banco de Credito del Peru | Financials |
|---|---|
| Interbank (Banco Internacional del Perú) | Financials |
| Grupo Romero | Conglomerates, Financials, Insurance, Consumer Discretionary |
| Minsur | Materials, Tin Mining |
| Compañía de Minas Buenaventura | Materials, Silver Mining |
| Alicorp | Consumer Staples, Packaged Foods & Meats |
| Ajegroup | Consumer Staples, Beverages |
Major Trade Partners — Import
| China | 29% |
|---|---|
| United States | 19% |
| Brazil | 7% |
| Argentina | 5% |
| Mexico | 4% |
Major Trade Partners — Export
| China | 32% |
|---|---|
| United States | 13% |
| South Korea | 5% |
| Japan | 5% |
| Canada | 5% |
Data Sources:
UN World Population Prospects
World Inequality Report
S&P Global Ratings
Moody’s
Fitch Ratings
IMF Direction of Trade Statistics (DOTS)
UN Conference on Trade and Development (UNCTAD)
CIA The World Factbook
World Bank’s World Integrated Trade Solution
Forbes Global 2000