
Includes historical data for Qatar’s Gross Domestic Product growth, debt-to-GDP ratio and more, as well as information on trade, banking and financial sector leadership.
Economy Continues Growth Trajectory
One of the world’s wealthiest nations thanks to its vast deposits of natural gas and oil, Qatar boasts one of the highest per capita incomes globally. In line with the National Vision 2030’s initiative of broadening the economic base, the government has successfully encouraged private investment across sectors ranging from tourism and infrastructure, to financial services and information and communications technology. Up to 100% foreign ownership of businesses in most sectors is allowed. However, reservations among foreign investors persist. Qatar ranks low on gender equality and female participation in the labor force, rigid cultural norms are broadly implemented, and employment rules are strictly regulated.
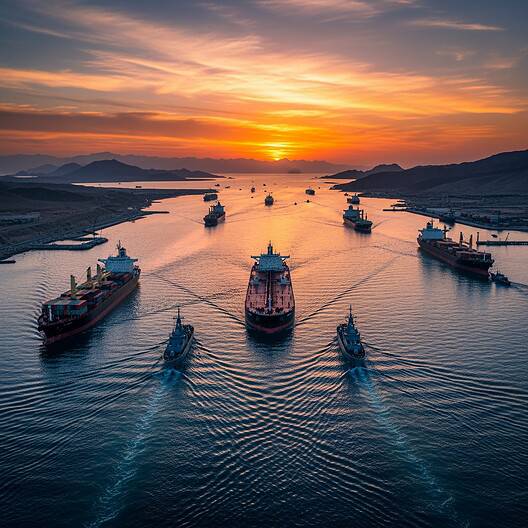
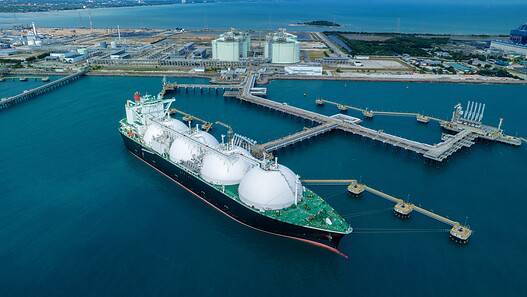
Already one of the world’s biggest liquified natural gas exporters, Qatar is expected to more than double its LNG output to over 140 million tonnes per annum by 2030 thanks to the North Field expansion project. Qatar has cemented its status as a cornerstone of stability and a champion of diplomacy in a volatile region.
Browse additional economic indicators and data sets below to learn more about Qatar’s economic outlook, finance sector and international trade performance. Each year, Global Finance editors identify Qatar’s safest bank, and recognise the best banks in a range of categories, including Best Foreign Exchange, Best Trade & Supply Chain Finance, Best Private Banking and more.
Macroeconomy & Sovereign Data
| Type of Government | Constitutional Monarchy |
|---|---|
| Capital | Doha |
| Sovereign Ratings |
S&P: AA Moody’s: Aa2 Fitch: AA |
| Total Population |
3.1 Million |
| Median Age | 33.5 |
| Adult Per Capita Income (PPP) | USD 121,803 |
| Total GDP (2025) | USD 222 billion |
Qatar GDP & Economic Overview
Most Recent Content


Banking & Finance
Overview
| Central Bank | Central Bank of Qatar |
|---|---|
| Currency | Qatari Riyal (QAR) |
| International Reserves | USD 66.7 billion |
| Stock Exchange |
Qatar Stock Exchange (QSE) |
Trade & Investment
| Total Exports |
USD 95 billion (2024) |
|---|---|
| Leading Exports |
Natural Gas Crude Petroleum Refined Petroleum Fertilizers Ethylene Polymers |
| Total Imports |
USD 35 billion (2024) |
| Leading Imports |
Gas Turbines Jewelry Cars Garments Aircraft |
| Sources: | CIA Factbook, International Monetary Fund |
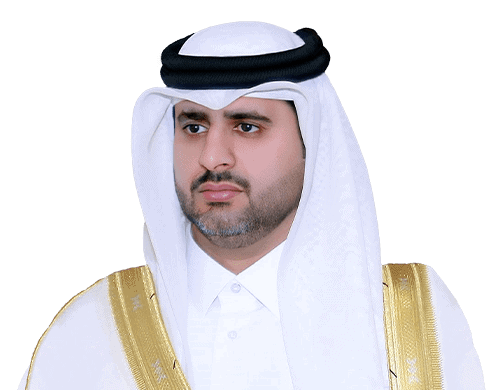
Bandar bin Mohammed bin Saoud Al-Thani has led Qatar’s central bank since November 2021.
Qatar Leading Companies
| Qatar National Bank | Banking & Financial Services |
|---|---|
| Qatar Islamic Bank | Financials |
| Commercial Bank of Qatar | Financials |
| Industries Qatar | Materials, Chemicals |
| Ooredoo | Telecommunication Services |
| Qatar Petroleum | Oil & Gas Exploration & Production |
| Al Jazeera Media Network | Media, Broadcasting |
Major Trade Partners – Import
| China | 16% |
|---|---|
| United States | 15% |
| India | 6% |
| Italy | 6% |
| Germany | 5% |
Source: World Integrated Trade Solution
Major Trade Partners – Export
| China | 16% |
|---|---|
| India | 12% |
| South Korea | 11% |
| Japan | 10% |
| United Kingdom | 7% |
Source: World Integrated Trade Solution
Global Finance Rankings & Awards


Data Sources:
UN World Population Prospects
World Inequality Report
S&P Global Ratings
Moody’s
Fitch Ratings
IMF Direction of Trade Statistics (DOTS)
UN Conference on Trade and Development (UNCTAD)
CIA The World Factbook
World Bank’s World Integrated Trade Solution
Forbes Global 2000