Includes historical data for Republic Of The Congo’s Gross Domestic Product growth, debt-to-GDP ratio and more, as well as information on trade, banking and financial sector leadership.
Economy Reliant On Oil Exports
Strategically positioned in Central Africa, the Republic of Congo has a population of a little over 6 million, with more than half under the age of 20. Civil wars and militia conflicts have plagued the Republic of Congo since its independence from France in 1960. Still, Congo is one of sub-Saharan Africa’s largest producers of oil, representing the largest sector of the economy and contributing about 60% of the government’s revenue. The non-oil sectors include abundant agricultural and mineral resources, logging, telecommunications, and construction.
Highly urbanized, with more than half of the population living in the main cities of Brazzaville and Pointe-Noire, in recent years the country has made significant investments in its transport, energy and telecommunications infrastructure. However, important challenges to the country’s full economic and social development remain. These include widespread extreme poverty, extensive state control in the economy, corruption and a slow pace of reform, and a volatile security situation in the eastern part of the country due to the presence of multiple armed militias. Furthermore, the poorly diversified economy is exposed to fluctuations in commodity prices and climate shocks.
Macroeconomy & Sovereign Data
| Type of Government | Democratic republic |
|---|---|
| Capital | Brazzaville |
| Sovereign Ratings |
S&P: CCC+ Moody’s: B3 Fitch: CCC |
| Total Population | 6.3 million |
| Median Age | 18.5 |
| Adult Per Capita Income (PPP) | 7,944.46 |
| Total GDP (2023) | 15.5 billion |
Republic of the Congo GDP & Economic Overview
Most Recent Content
Republic of the Congo
Emerging & Frontier Markets
Cover Story: Africa Leads The Way To A New Era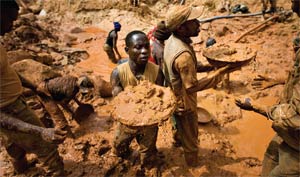
Emerging & Frontier Markets
Emerging Markets: Africa
Capital Raising & Corporate Finance
Cover Story : Africa in SqueezeBanking & Finance
Trade & Investment
| Total Exports | USD 4.9 billion (2023) |
|---|---|
| Leading Exports |
Copper Crude Petroleum Refined Petroleum Lumber Tin |
| Total Imports | USD 14.0 billion (2022) |
| Leading Imports |
Ships Chicken Products Refined Petroleum Processed Fish Packaged Medicines |
| Source: | World Integrated Trade Solution |
Republic of the Congo Leading Companies
| Bank Congolaise de l’Habitat | Financials |
|---|---|
| Bangue Postale du Congo | Financials |
| Société Nationale des Pétroles du Congo | Oil & Gas Exploration & Production |
| Société Nationale d'Electricité | Utilities |
| Société Congolaise de Transports Maritimes | Transportation Infrastructure Services |
| Congolaise Industrielle des Bois | Materials, Forest Products |
Major Trade Partners — Import
| China | 20% |
|---|---|
| France | 12% |
| Belgium | 9% |
| Russia | 4% |
| United States | 4% |
Source: World Integrated Trade Solution
Major Trade Partners — Export
| China | 46% |
|---|---|
| Côte d'Ivoire | 9% |
| Togo | 8% |
| Cameroon | 6% |
| Gabon | 4% |
Source: World Integrated Trade Solution
Add title…
Add your content here…
Data Sources:
UN World Population Prospects
World Inequality Report
S&P Global Ratings
Moody’s
Fitch Ratings
IMF Direction of Trade Statistics (DOTS)
UN Conference on Trade and Development (UNCTAD)
CIA The World Factbook
World Bank’s World Integrated Trade Solution
Forbes Global 2000