Includes historical data for Russia’s Gross Domestic Product growth, debt-to-GDP ratio and more, as well as information on trade, banking and financial sector leadership.
An Economy Geared Around Waging War
The invasion of Ukraine in February 2022 has marked a radical shift in the perception of the Russian market and business environment. Boasting vast natural resources, a strategic geographical position between Europe and Asia, a sizable domestic market of over 140 million people and a skilled labor force, Russia used to attract significant foreign investment. However, the imposition of US and European economic sanctions, along with the associated reputational risks involved in conducting operations in the country, forced many companies to reduce their operations or exit Russia entirely.
The conflict is expected to have long-lasting implications for Russia’s economic future. Regardless of the conflict’s outcome, Russia is poised to confront challenges stemming from its heavy reliance on hydrocarbons, which contribute to about 40% of its GDP, as well as its inadequate infrastructure and dependence on foreign technology. Additionally, systemic structural issues such as widespread corruption, state interference in the economy and security risks will continue to hinder entrepreneurial dynamism.
Macroeconomy & Sovereign Data
| Type of Government | Semi-presidential republic |
|---|---|
| Capital | Moscow |
| Sovereign Ratings |
S&P: Rating withdrawn Moody’s: Ca Fitch: C |
| Total Population | 142.9 million |
| Median Age | 39.6 |
| Adult Per Capita Income (PPP) | 35,062.92 |
| Total GDP (2023) | 2.1 trillion |
Russia GDP & Economic Overview
Most Recent Content
Russia
Economics, Policy & Regulation
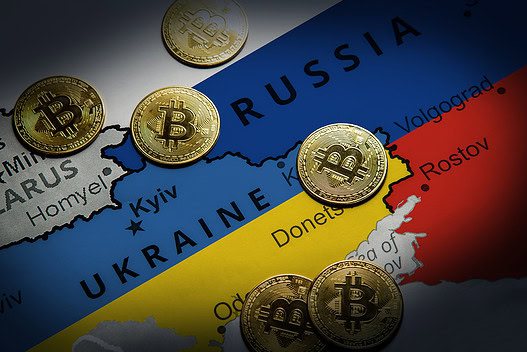
Russia Skirts Sanctions Using Bitcoin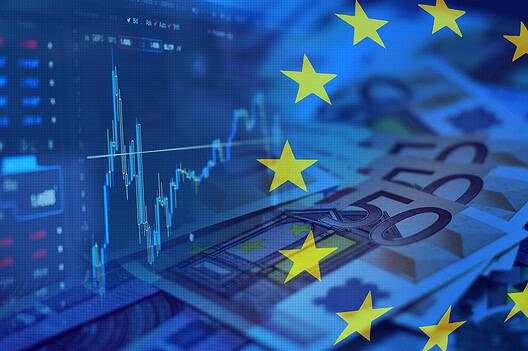
Economics, Policy & Regulation
Central Banker Report Cards 2024: Europe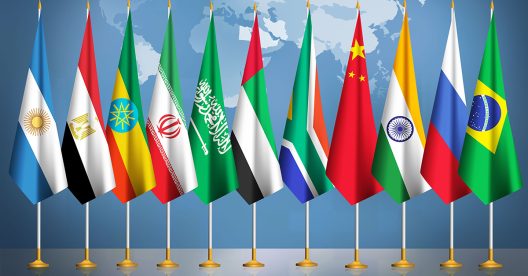
Economics, Policy & Regulation
Six New Members Join BRICS
Economics, Policy & Regulation
Ruble’s Slide Puts Nabiullina On The Hot SeatBanking & Finance
Trade & Investment
| Total Exports | USD 232.9 billion (2023) |
|---|---|
| Leading Exports |
Crude Petroleum Refined Petroleum Natural Gas Coal Wheat Iron |
| Total Imports | USD 613.9 billion (2022) |
| Leading Imports |
Cars And Vehicle Parts Packaged Medicines Broadcasting Equipment Aircraft Computers |
| Source: | World Integrated Trade Solution |
Russia Leading Companies
| Sberbank | Financials |
|---|---|
| VTB Bank | Financials |
| Gazprom | Oil & Gas Exploration & Production |
| Lukoil | Oil & Gas Exploration & Production |
| Magnit | Consumer Staples, Food Retail |
| X5 Group | Consumer Staples, Food Retail |
| MTS | Telecommunication Services |
Major Trade Partners — Import
| China | 25% |
|---|---|
| Germany | 9% |
| United States | 6% |
| Belarus | 5% |
| South Korea | 4% |
Source: World Integrated Trade Solution
Major Trade Partners — Export
| China | 14% |
|---|---|
| Netherlands | 9% |
| Germany | 6% |
| Türkiye | 5% |
| Belarus | 5% |
Source: World Integrated Trade Solution
Global Finance Rankings & Awards

Data Sources:
UN World Population Prospects
World Inequality Report
S&P Global Ratings
Moody’s
Fitch Ratings
IMF Direction of Trade Statistics (DOTS)
UN Conference on Trade and Development (UNCTAD)
CIA The World Factbook
World Bank’s World Integrated Trade Solution
Forbes Global 2000