
Includes historical data for Rwanda’s Gross Domestic Product growth, debt-to-GDP ratio and more, as well as information on trade, banking and financial sector leadership.
Economy Reliant On Oil Exports
This small landlocked country in east-central Africa has strived to preserve its political stability and economic growth since it was ravaged by the genocide against the Tutsi ethnic minority in 1994. With aspirations to become a middle-income country by 2035 and a high-income country by 2050, Rwanda has managed to rebuild its economy and reduce poverty and inequality with investments in agriculture, in the rapidly developing industrial and financial industry, and the burgeoning tourism sector. As a result, today Rwanda offers one of the most favorable business environments on the continent.
Still, inclusive growth remains a key challenge, with weak rule of law and corruption discouraging entrepreneurial activity. High dependence on imported commodities and international aid persists. Despite relatively flexible labor regulations, a more vibrant formal labor market has not fully developed. Additionally, agriculture is exposed to the risks of climate change and fluctuations in commodity prices.
Macroeconomy & Sovereign Data
| Type of Government | Presidential republic |
|---|---|
| Capital | Kigali |
| Sovereign Ratings |
S&P: B+ Moody’s: B2 Fitch: B+ |
| Total Population | 13.9 million |
| Median Age | 19.6 |
| Adult Per Capita Income (PPP) | 5,474.35 |
| Total GDP (2023) | 13.7 billion |
Rwanda GDP & Economic Overview
Most Recent Content
Rwanda
Economics, Policy & Regulation
Central Banker Report Cards 2024: Africa And The Middle East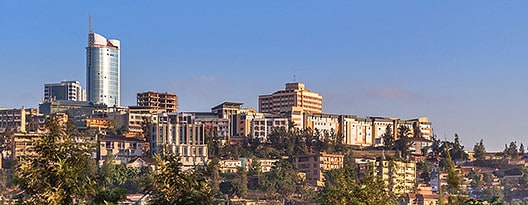
Emerging & Frontier Markets
Rwanda: Future UncertainCapital Raising & Corporate Finance
ANNUAL SURVEY: WORLD’S BEST BANKS 2014Banking & Finance
Trade & Investment
| Total Exports | USD 2.4 billion (2023) |
|---|---|
| Leading Exports |
Gold Refined Petroleum Coffee Tea Tin |
| Total Imports | USD 1.1 billion (2022) |
| Leading Imports |
Refined Petroleum Gold Raw Sugar Packaged Medicines Broadcasting Equipment |
| Source: | World Integrated Trade Solution |
Rwanda Leading Companies
| Bank of Kigali | Financials |
|---|---|
| Rwanda Development Bank | Financials |
| Great Lakes Energy | Utilities, Renewable Electricity |
| Cimerwa | Construction Materials |
| Rwandair | Airline |
| Rwanda Mountain Tea | Consumer Staples, Beverages |
| Bralirwa | Consumer Staples, Beverages |
Major Trade Partners — Import
| China | 19% |
|---|---|
| Tanzania | 13% |
| United Arab Emirates | 8% |
| India | 8% |
| Kenya | 8% |
Source: World Integrated Trade Solution
Major Trade Partners — Export
| Democratic Republic of the Congo | 38% |
|---|---|
| United Arab Emirates | 28% |
| Tanzania | 6% |
| United Kingdom | 3% |
| Pakistan | 2% |
Source: World Integrated Trade Solution
Global Finance Rankings & Awards


Data Sources:
UN World Population Prospects
World Inequality Report
S&P Global Ratings
Moody’s
Fitch Ratings
IMF Direction of Trade Statistics (DOTS)
UN Conference on Trade and Development (UNCTAD)
CIA The World Factbook
World Bank’s World Integrated Trade Solution
Forbes Global 2000